 Global| Aug 23 2007
Borrowings at the Federal Reserve Largest in 6 Years; Big Drops in Commercial Paper Outstanding
Summary
Financial markets have been in a "liquidity crisis". Weekly Federal Reserve data reported just this afternoon and also earlier today give several measures of this for the US and highlight what the Federal Reserve and bankers are [...]
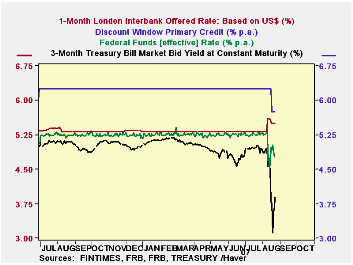
Financial markets have been in a "liquidity crisis". Weekly Federal Reserve data reported just this afternoon and also earlier today give several measures of this for the US and highlight what the Federal Reserve and bankers are trying to do about it. Some evidence is shown in the graph of interest rates here. In the paragraph below, we discuss the discount and fed funds rates. Also, of late, there have been divergent moves in key money rates, such as LIBOR, which has risen and Treasury bills, which have plunged. Investors with that scarce commodity "cash" want to keep it safe and have poured substantial sums into the shortest most liquid asset of all, Treasury bills, while users of ordinarily highly liquid money markets have found themselves paying a premium.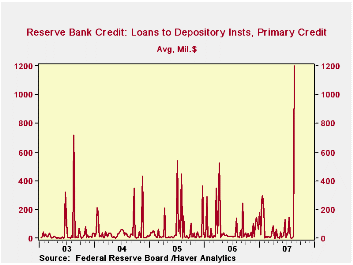
As conditions such as this worsened last Friday, the Federal Reserve Board reduced the discount rate by 50 basis points, cutting the spread between it and the federal funds rate. The Fed encouraged banks to borrow at the central bank, trying to tell them there would be no stigma attached to doing so. Today's weekly report on "factors affecting reserves", the Fed's H.4.1 release, shows that this pushed so-called "primary credit" at Federal Reserve Banks to a daily average of $1,200 million, the largest amount since the aftermath of September 11, 2001. The other notable figure in the table below is "secondary credit". Banks with more serious problems can borrow under more liberal terms if they pay a premium rate higher still than the discount rate. While the amount of these borrowings last week was small, $85 million per day, this borrowing hardly ever occurs at all; the last instance was $21 million in the week of March 14 and before that $152 million October 5, 2005. These borrowings inject funds into the banking system, and while only banks can go to the discount window, these monies are surely helping them funds their own customers.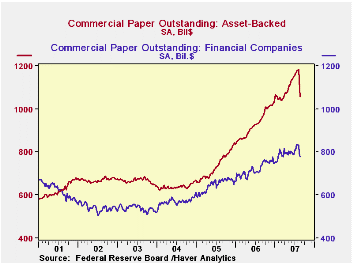
And why might their customers need funding? Among other needs, many of them have been cut out of the commercial paper market. We spoke here a couple of weeks ago about asset-backed commercial paper, which is used as a short-term source of funds by issuers of MBS and ABS securities while they prepare packages of securities for sale in the bond market or meet other liquidity needs. We mentioned then that this paper had become larger in total than paper issued by traditional corporate and finance company borrowers and indicated that it was likely imparting risk to commercial paper that would be unusual for this market sector. No sooner were the words out of our computer than that market seized up. Just how much is plain in the chart here. It's amazing. Haver's quality-assurance programs that pick up out-liers in data, warning database managers that something may be wrong with the figures, found this one. There was no mistake, though. A market that had been growing by $4 billion a week shrank by $125 billion over two weeks.
Some markets, such as stocks, seem to be settling just a bit from the recent turmoil. Certainly the Federal Reserve is trying to get money to places where it is needed and banks, whose basic function of making loans to borrowers had seemed to be diminishing in importance relative to their trading and asset/liability management activities, have found once again their key roles as financial intermediaries.
| Million $ | 8/22/07 | 8/15/07 | 8/08/07 | July 2007 | Jan-June 2007 | 2006 |
|---|---|---|---|---|---|---|
| Loans to Deposit Institutions | 1,541 | 271 | 251 | 258 | 110 | 225 |
| Primary | 1,200 | 11 | 1 | 52 | 52 | 59 |
| Secondary | 85 | 0 | 0 | 0 | 1 | 0 |
| Seasonal | 256 | 260 | 249 | 206 | 56 | 166 |
| Percent | ||||||
| Fed Funds Rate | 4.91 | 4.79 | 5.25 | 5.26 | 5.25 | 4.96 |
| Discount Rate | 5.82 | 6.25 | 6.25 | 6.25 | 6.25 | 5.96 |
| Seas. Adj. Bil. $ | ||||||
| Commercial Paper--Total | 2,042.2 | 2,132.4 | 2,223.5 | 2,191.5 | 2,045.8 | 1,798.0 |
| Asset-Backed | 1,057.4 | 1,134.5 | 1,182.9 | 1,167.7 | 1,080.1 | 931.4 |
| Weekly Change | -77.1 | -48.4 | +2.1 | +6.7 | +4.2 | +4.0 |
by Tom Moeller August 23, 2007
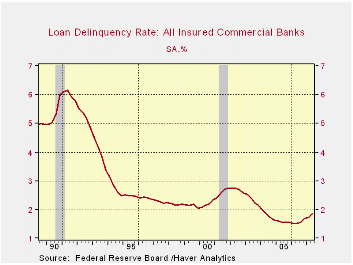
For all the media hype regarding the "subprime" loan issuance problem, the latest data issued by the Federal Reserve Board for 2Q07 indicate only slight increases in delinquent payments on consumer, real estate and commercial & industrial loans at commercial banks.
Even if delinquencies rise further this quarter (which they probably will), the levels are still quite low absolutely and relative to historical comparison, i.e., relative to the late 1980s and the early 1990s.
For all loans and leases, the delinquency rate increased to 1.86% during the second quarter from 1.72% during 1Q07. That level is up versus 1.57% during the prior two years but, still, it is only a third of the delinquency rate during the last two recessions.
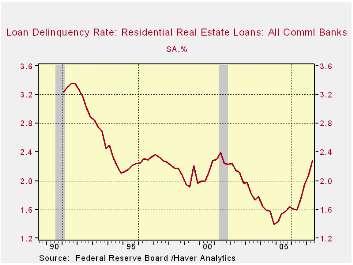
The rise in delinquent payments on residential real estate loans indeed is more dramatic to 2.28% from 2.07% in 1Q07. It is equal to where it was during the last recession. Yet these figures are below the high seen in 1991 of 3.32%. Again, these comments await the update for this quarter.
For consumer loans, the delinquency rate rose to 3.02% from 2.98% during 1Q. That's up from the 2005 low of 2.82%, but down from the highs during the last two recessions. It's lower even than the 3.75% range that prevailed during the late 1990s expansion.
Delinquencies on C&I loans actually fell q/q to 1.17% from 1.18% during 1Q. Delinquent C&I loans last year averaged 1.27% of the total outstanding.
These data series are available in Haver's USECON database.
Subprime Mortgages is recent Congressional testimony delivered by Sandra F. Braunstein of the Federal Reserve Board and it is available here.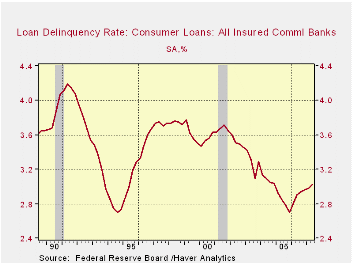
by Robert Brusca August 23, 2007
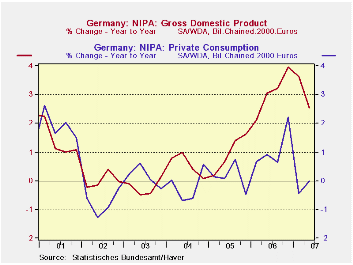
Germany is a much more export oriented economy than is the United States. With the formation of the EMU, Germany was helped by having a large proportion of its trade no longer subject to foreign exchange fluctuations. Goods sold outside Germany are still exports, but if they are sold to EMU members the currency of the transaction does not change.
German private consumption is only 55% of German GDP. Compared to the US where personal consumption is over 70% of GDP.Also German exports are 49% of GDP whereas in the US exports of goods and service are only about 11% of GDP. The German economy has a structure very different from the US. Still at 55% of GDP the German economy needs to get the consumer involved to have its expansion last. Germany’s economy is being carried by its export strength compared to weaker imports and strong business capital formation. But it will need more for the expansion to endure. Germany like many other EMU countries continues to show that order demand outside the country is much stronger than within. Overall orders remain strong for Germany and France. For the time being the expansion still seems to be in place. But it must broaden. The risk cited recently in the Zew survey is that confidence may have been hurt by financial turmoil. This remains something to be on the look-out for in Germany as well as throughout the Euro area.
| GDP | Private Consumption | Public Consumption | Total Capital Formation | Housing | Exports | Imports | Domestic Demand | |
| % change Q/Q; X-M is Q/Q change in billions of chained 2000 euros | ||||||||
| Q2-07 | 1.0% | 2.5% | -0.7% | 10.3% | -18.0% | 3.6% | -3.5% | -2.2% |
| Q1-07 | 2.2% | -7.0% | 6.9% | 15.7% | 5.8% | -1.2% | 8.7% | 6.8% |
| Q4-06 | 4.0% | 3.4% | 0.0% | 10.8% | 6.2% | 23.0% | 5.4% | -3.6% |
| Q3-06 | 3.0% | 1.4% | 2.1% | -2.4% | 8.0% | 13.9% | 14.9% | 2.7% |
| % change Yr/Yr; X-M is Yr/Yr change in Gap in billions of chained 2000 euros | ||||||||
| Q2-07 | 2.5% | 0.0% | 2.0% | 8.4% | -0.1% | 9.4% | 6.2% | 0.8% |
| Q1-07 | 3.6% | -0.5% | 2.1% | 11.7% | 12.7% | 10.4% | 7.9% | 2.3% |
| Q4-06 | 3.9% | 2.2% | 0.9% | 7.1% | 6.6% | 16.1% | 9.7% | 0.8% |
| Q3-06 | 3.2% | 0.6% | 0.8% | 9.4% | 7.2% | 11.6% | 11.0% | 2.6% |
| 5-Yrs | 1.3% | 0.2% | 0.4% | 5.8% | -0.7% | 7.8% | 6.9% | 0.7% |
by Robert Brusca August 23, 2007
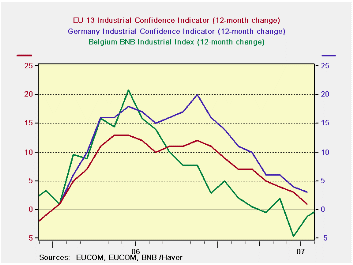
The BNB index fell to 3.3 in August from 4.2 in July and, along with the German Zew index, it gives us a signal of softening activity in the Euro area. However the decline in the index is not severe and the Belgian metric continues to signal small gains year-over-year. There is no evidence of financial contagion here.
This index does not apply to one of the large Euro countries, but it is an actual survey of industry respondents not just of financial experts, unlike Germany’sZew Index. Also it is available earlier than most major Euro area country surveys. And those are the reasons we are attracted to it. Since Belgium is well-integrated into the EU and is a relatively small economy its activity tends to reflect that of its larger neighbors. Not surprisingly this report is treated as a harbinger of sorts for the upcoming EU and German surveys.
Viewed in that way the Belgian index’s slide is not very severe. The Zew index in Germany fell by more partly because it is executed on a survey of financial experts who might see trouble coming before it hits real data or who might exaggerate the importance of a financial disruption to the real economy. At this point, we do not know if Zew respondents are prescient or lacking in staying power. In truth neither do we really know how widespread disruptions will get or even how widespread they ARE. But the BNB Survey says as of this time the slowdown is minor – at least in Belgium.
This survey like others before it and others for other Euro area member countries, displays weaker domestic than foreign orders. This has become a Euro area theme of sorts. And while the total order assessment is lower than a year ago, foreign orders are assessed stronger. Wholesaling and retailing in Belgium continue to climb even though the joint sector reading is lower on a year/year basis. On balance Belgium does not seem much affected by the financial turmoil. On the other hand it is not clear how much turmoil had been underway at the time respondents filled in their surveys. Contagion is something we will continue to watch for over the next several months at least.
| Aug-07 | Jul-07 | Jun-07 | 3-Mo Change | 6-Mo Change | 12-Mo Change | |
| Total Industry | 3.3 | 4.2 | 5.5 | -0.6 | -0.2 | 0.2 |
| Manufacturing | 2.8 | 4.5 | 6.5 | -1.1 | 0.8 | -0.5 |
| Production | 4.0 | 4.0 | 8.0 | -1.0 | -2.0 | -2.0 |
| Domestic Orders | 1.0 | -2.0 | 5.0 | -3.0 | -7.0 | 0.0 |
| Foreign Orders | 9.0 | 14.0 | 11.0 | 6.0 | 2.0 | 10.0 |
| Prices | 2.0 | 7.0 | 13.0 | -5.0 | -9.0 | -9.0 |
| Current Assets | ||||||
| Total Orders | 0.0 | 2.0 | 3.0 | -4.0 | 0.0 | -4.0 |
| Foreign Orders | 2.0 | 4.0 | 4.0 | 1.0 | 5.0 | -1.0 |
| Inventories | 0.0 | -3.0 | -7.0 | 1.0 | -4.0 | 0.0 |
| -- | -- | -- | 0.0 | 0.0 | 0.0 | |
| Wholesale & Retail Trade | 6.5 | 4.8 | 4.2 | -0.8 | 0.7 | 5.0 |
| Construction | 2.3 | 2.1 | 2.3 | 2.0 | -6.0 | -1.7 |
| Comparisons: | Changes lag one month | |||||
| EU Index: Industry | #N/A | 5.0 | 6.0 | -2.0 | -1.0 | 1.0 |
| Germany Index: Industry | #N/A | 8.0 | 9.0 | -1.0 | -1.0 | 3.0 |
by Tom Moeller August 23, 2007
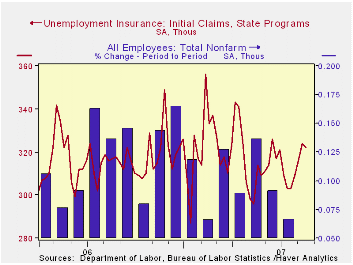
Initial claims for unemployment insurance fell slightly last week, back to the level initially reported for the prior period. Claims for the week ending 8/18 fell to 322,000 from 324,000 during the week ended 8/11. Consensus expectations were for 320,000 claims in the latest week.
A claims level below 400,000 typically has been associated with growth in nonfarm payrolls. During the last ten years there has been a (negative) 78% correlation between the level of initial claims and the m/m change in nonfarm payroll employment.
The latest figure is for the survey period for nonfarm payrolls due for release on September 7th. Claims rose 6.3% from the July period. A 7.1% decline in July claims was associated with the below average 92,000 increase in payrolls.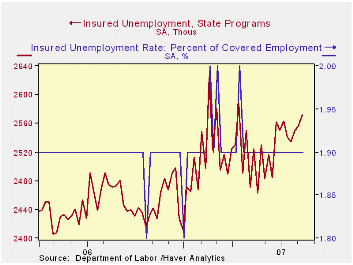
The four-week moving average of initial claims rose to 317,750 (0.3% y/y), its highest level since early July.
Continuing claims for unemployment insurance rose 16,000 after a downwardly revised 6,000 increase during the prior week. The continuing claims numbers lag the initial claims figures by one week.
The insured rate of unemployment remained at 1.9%.
The Minimum Wage and the Labor Market from the Federal Reserve Bank of Cleveland is available here.
| Unemployment Insurance (000s) | 08/18/07 | 08/11/07 | Y/Y | 2006 | 2005 | 2004 |
|---|---|---|---|---|---|---|
| Initial Claims | 322 | 324 | 1.6% | 313 | 331 | 343 |
| Continuing Claims | -- | 2,572 | 3.9% | 2,545 | 3.3% | 2,459 |
Carol Stone, CBE
AuthorMore in Author Profile »Carol Stone, CBE came to Haver Analytics in 2003 following more than 35 years as a financial market economist at major Wall Street financial institutions, most especially Merrill Lynch and Nomura Securities. She had broad experience in analysis and forecasting of flow-of-funds accounts, the federal budget and Federal Reserve operations. At Nomura Securities, among other duties, she developed various indicator forecasting tools and edited a daily global publication produced in London and New York for readers in Tokyo. At Haver Analytics, Carol was a member of the Research Department, aiding database managers with research and documentation efforts, as well as posting commentary on select economic reports. In addition, she conducted Ways-of-the-World, a blog on economic issues for an Episcopal-Church-affiliated website, The Geranium Farm. During her career, Carol served as an officer of the Money Marketeers and the Downtown Economists Club. She had a PhD from NYU's Stern School of Business. She lived in Brooklyn, New York, and had a weekend home on Long Island.
More Economy in Brief
 Global| Feb 05 2026
Charts of the Week: Balanced Policy, Resilient Data and AI Narratives
by:Andrew Cates


