 Global| Aug 23 2007
Borrowings at the Federal Reserve Largest in 6 Years; Big Drops in Commercial Paper Outstanding
Summary
Financial markets have been in a "liquidity crisis". Weekly Federal Reserve data reported just this afternoon and also earlier today give several measures of this for the US and highlight what the Federal Reserve and bankers are [...]

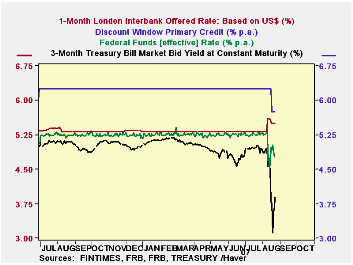
Financial markets have been in a "liquidity crisis". Weekly Federal Reserve data reported just this afternoon and also earlier today give several measures of this for the US and highlight what the Federal Reserve and bankers are trying to do about it. Some evidence is shown in the graph of interest rates here. In the paragraph below, we discuss the discount and fed funds rates. Also, of late, there have been divergent moves in key money rates, such as LIBOR, which has risen and Treasury bills, which have plunged. Investors with that scarce commodity "cash" want to keep it safe and have poured substantial sums into the shortest most liquid asset of all, Treasury bills, while users of ordinarily highly liquid money markets have found themselves paying a premium.
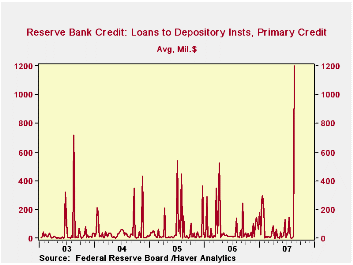
As conditions such as this worsened last Friday, the Federal Reserve Board reduced the discount rate by 50 basis points, cutting the spread between it and the federal funds rate. The Fed encouraged banks to borrow at the central bank, trying to tell them there would be no stigma attached to doing so. Today's weekly report on "factors affecting reserves", the Fed's H.4.1 release, shows that this pushed so-called "primary credit" at Federal Reserve Banks to a daily average of $1,200 million, the largest amount since the aftermath of September 11, 2001. The other notable figure in the table below is "secondary credit". Banks with more serious problems can borrow under more liberal terms if they pay a premium rate higher still than the discount rate. While the amount of these borrowings last week was small, $85 million per day, this borrowing hardly ever occurs at all; the last instance was $21 million in the week of March 14 and before that $152 million October 5, 2005. These borrowings inject funds into the banking system, and while only banks can go to the discount window, these monies are surely helping them funds their own customers.
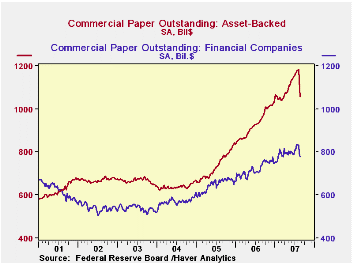
And why might their customers need funding? Among other needs, many of them have been cut out of the commercial paper market. We spoke here a couple of weeks ago about asset-backed commercial paper, which is used as a short-term source of funds by issuers of MBS and ABS securities while they prepare packages of securities for sale in the bond market or meet other liquidity needs. We mentioned then that this paper had become larger in total than paper issued by traditional corporate and finance company borrowers and indicated that it was likely imparting risk to commercial paper that would be unusual for this market sector. No sooner were the words out of our computer than that market seized up. Just how much is plain in the chart here. It's amazing. Haver's quality-assurance programs that pick up out-liers in data, warning database managers that something may be wrong with the figures, found this one. There was no mistake, though. A market that had been growing by $4 billion a week shrank by $125 billion over two weeks.
Some markets, such as stocks, seem to be settling just a bit from the recent turmoil. Certainly the Federal Reserve is trying to get money to places where it is needed and banks, whose basic function of making loans to borrowers had seemed to be diminishing in importance relative to their trading and asset/liability management activities, have found once again their key roles as financial intermediaries.
| Million $ | 8/22/07 | 8/15/07 | 8/08/07 | July 2007 | Jan-June 2007 | 2006 |
|---|---|---|---|---|---|---|
| Loans to Deposit Institutions | 1,541 | 271 | 251 | 258 | 110 | 225 |
| Primary | 1,200 | 11 | 1 | 52 | 52 | 59 |
| Secondary | 85 | 0 | 0 | 0 | 1 | 0 |
| Seasonal | 256 | 260 | 249 | 206 | 56 | 166 |
| Percent | ||||||
| Fed Funds Rate | 4.91 | 4.79 | 5.25 | 5.26 | 5.25 | 4.96 |
| Discount Rate | 5.82 | 6.25 | 6.25 | 6.25 | 6.25 | 5.96 |
| Seas. Adj. Bil. $ | ||||||
| Commercial Paper--Total | 2,042.2 | 2,132.4 | 2,223.5 | 2,191.5 | 2,045.8 | 1,798.0 |
| Asset-Backed | 1,057.4 | 1,134.5 | 1,182.9 | 1,167.7 | 1,080.1 | 931.4 |
| Weekly Change | -77.1 | -48.4 | +2.1 | +6.7 | +4.2 | +4.0 |
Carol Stone, CBE
AuthorMore in Author Profile »Carol Stone, CBE came to Haver Analytics in 2003 following more than 35 years as a financial market economist at major Wall Street financial institutions, most especially Merrill Lynch and Nomura Securities. She has broad experience in analysis and forecasting of flow-of-funds accounts, the federal budget and Federal Reserve operations. At Nomura Securites, among other duties, she developed various indicator forecasting tools and edited a daily global publication produced in London and New York for readers in Tokyo. At Haver Analytics, Carol is a member of the Research Department, aiding database managers with research and documentation efforts, as well as posting commentary on select economic reports. In addition, she conducts Ways-of-the-World, a blog on economic issues for an Episcopal-Church-affiliated website, The Geranium Farm. During her career, Carol served as an officer of the Money Marketeers and the Downtown Economists Club. She has a PhD from NYU's Stern School of Business. She lives in Brooklyn, New York, and has a weekend home on Long Island.


