 Global| Jan 12 2007
Broad Industrial Production Advance in India
Summary
Industrial production in India was strong again in November, extending a long but irregular uptrend in the industrial sector of that rapidly emerging economy. According to the Central Statistical Organization, IP was up 5.5% in the [...]

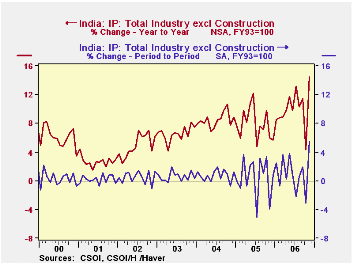
Industrial production in India was strong again in November, extending a long but irregular uptrend in the industrial sector of that rapidly emerging economy. According to the Central Statistical Organization, IP was up 5.5% in the month and 14.4% on the year. The CSO data are not seasonally adjusted. The month-to-month comparison quoted here is taken from seasonal adjustment performed by Haver Analytics. Because the month-to-month movements are very erratic, our discussion below covers yearly growth trends both in the latest month and over a longer period.
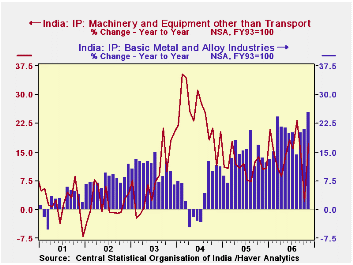
Marked acceleration of even heavy industry is evident in the categorical breakdown. Basic metals and alloys surged by 25.4% over November 2005, a third consecutive month of 20%-plus yearly gains. Machinery excluding transport equipment expanded 17.3% in November and the last six months have run 14.9% ahead of the comparable year-ago period. Nonmetallic mineral products have a similar pattern, with November up 17.7% and the last six months up 13.8% on the year-ago period.
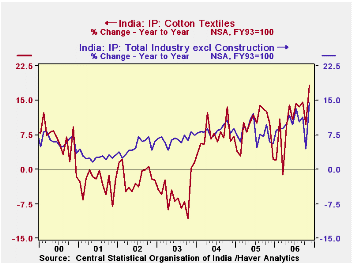
Among "softer" products, rubber, plastics and petroleum expanded 23.2% in November and 13.1% in the six-month period. This follows a particularly weak performance over the prior five years. Cotton textiles, the kind of manufacturing often associated with India, had experienced a long period of little or no growth, but has lately staged a comeback. By November 2006, production here was up 18.3% from November 2005 and the six months are up 13.5% from the same time in 2005.
The service sector in India remains far larger than manufacturing, measured by gross value added. But these gains in industrial production show a significant diversification of the Indian economy. While every nation need not be a major player in world metals markets or motor vehicles, the breadth of recent gains -- especially the return of strength in textiles -- gives a firmer foundation for further development.
| India (NSA, yr/yr % changes) | Nov 2006 | Oct 2006 | Sept 2006 | 2005 | 2004 | 2003 |
|---|---|---|---|---|---|---|
| General Industrial Production (SA, FY93=100) |
250.9 | 237.9 | 245.5 | 216.7 | 200.8 | 185.2 |
| Mo/Mo % Chg, SA | 5.5 | -3.1 | 1.9 | -- | -- | -- |
| Yr/Yr % Chg, NSA | 14.4 | 4.4 | 11.4 | 7.9 | 8.5 | 6.6 |
| Manufacturing | 15.7 | 3.8 | 12.0 | 9.0 | 8.9 | 7.1 |
| Cotton Textiles | 18.3 | 9.7 | 14.7 | 9.1 | 7.4 | -5.3 |
| Rubber, Plastic, Petroleum | 23.2 | 7.7 | 15.7 | 3.9 | 1.2 | 7.2 |
| Basic Metals & Alloys | 25.4 | 20.9 | 20.0 | 13.8 | 4.3 | 10.9 |
| Machinery ex Transport | 17.3 | 2.1 | 14.2 | 11.5 | 24.3 | 8.3 |
Carol Stone, CBE
AuthorMore in Author Profile »Carol Stone, CBE came to Haver Analytics in 2003 following more than 35 years as a financial market economist at major Wall Street financial institutions, most especially Merrill Lynch and Nomura Securities. She had broad experience in analysis and forecasting of flow-of-funds accounts, the federal budget and Federal Reserve operations. At Nomura Securities, among other duties, she developed various indicator forecasting tools and edited a daily global publication produced in London and New York for readers in Tokyo. At Haver Analytics, Carol was a member of the Research Department, aiding database managers with research and documentation efforts, as well as posting commentary on select economic reports. In addition, she conducted Ways-of-the-World, a blog on economic issues for an Episcopal-Church-affiliated website, The Geranium Farm. During her career, Carol served as an officer of the Money Marketeers and the Downtown Economists Club. She had a PhD from NYU's Stern School of Business. She lived in Brooklyn, New York, and had a weekend home on Long Island.
More Economy in Brief
 Global| Feb 05 2026
Charts of the Week: Balanced Policy, Resilient Data and AI Narratives
by:Andrew Cates


