 Global| Jun 26 2007
Business and Consumer Confidence in Italy and the Netherlands
Summary
The Netherlands released June data on consumer and business confidence today and Italy released data on business confidence, having released data on consumer confidence last week. In Italy confidence is expressed as an index with [...]

The Netherlands released June data on consumer and business confidence today and Italy released data on business confidence, having released data on consumer confidence last week. In Italy confidence is expressed as an index with 2000=100 while in the Netherlands it is measured by the percent of optimists over the percent of pessimists.
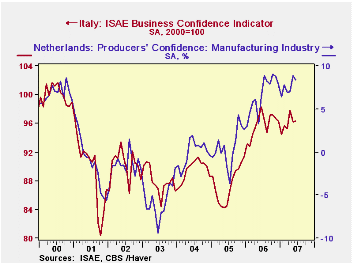
Business confidence in both countries showed little change in the month of June. In Italy it was a little stronger--96.3 vs. 96.2--and in the Netherlands, a little weaker--8.5% vs. 8.9%. However, it appears that the level of business confidence is higher in the Netherlands than in Italy. The first chart compares the two measures of business confidence since 2000 when both measures were at historical highs. Business confidence in the Netherlands is above its 2000 highs while business confidence in Italy is still below its 2000 highs.
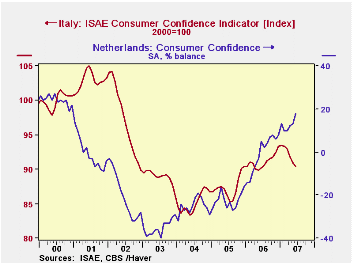
A different picture emerges when consumer confidence is compared between the two countries. Dutch consumer confidence rose by five percentage points in June while Italian consumer confidence fell by 2.1%. Over the longer period, however, until early 2006, Italian consumers were more optimistic than their Dutch counterparts. It has only been since then that Dutch consumers have become more confident than Italian consumers as can be seen in the second chart.
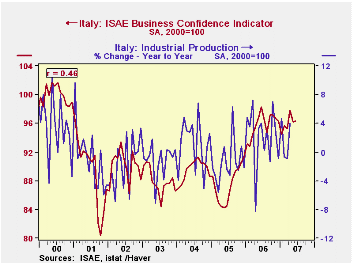
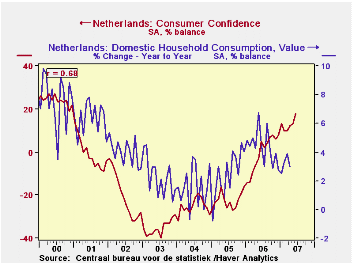
Confidence measures do have an impact on consumer and business behavior, however, the connection is tentative at best. To illustrate the point we plot the year to year changes in the series, Monthly Household Consumption for the Netherlands and the consumer confidence measure in the third chart. The correlation (R) between the two series is 68%. The R-square is 46%, which means that the confidence measure explains about 46% of the variations in the two series. We also plot the year to year change in Italian industrial production and the Italian business confidence indicator in the fourth. In this case, the correlation and R-square are even lower, 46% and 21%.

| CONFIDENCE MEASURES | Jun 07 | May 07 | Jun 06 | M/M | Y/Y | 2006 | 2005 | 2004 |
|---|---|---|---|---|---|---|---|---|
| Italy (2000=100) | ||||||||
| Business Confidence | 96.3 | 96.2 | 98.3 | 0.10 | -2.03 | 65.8 | 87.5 | 89.5 |
| Consumer Confidence | 107.2 | 109.4 | 107.0 | -2.10 | 0.19 | 108.7 | 104.2 | 101.5 |
| Netherlands (% Balance) | ||||||||
| Business Confidence | 8.4 | 8.9 | 6.4 | -0.5 | 2 | 6.7 | 0.6 | -0.1 |
| Consumer Confidence | 18 | 13 | 5 | 5 | 13 | -1 | -22 | -25 |
More Economy in Brief
 Global| Feb 05 2026
Charts of the Week: Balanced Policy, Resilient Data and AI Narratives
by:Andrew Cates


