 Global| Dec 19 2011
Business Confidence And Activity Outlook In New Zealand
Summary
The year has seen big swings in business confidence and in the outlook for activity in New Zealand. Confidence and the Activity Outlook are measured by the balance of opinion--those who see an improvement less those who see [...]
 The year has seen big swings in business confidence and in the outlook
for activity in New Zealand. Confidence and the Activity
Outlook are measured by the balance of opinion--those who see an improvement
less those who see deterioration. In short, the balance between the
optimists and the pessimists. The earthquake in Christchurch in February
was followed by sharp declines both in confidence and the activity outlook
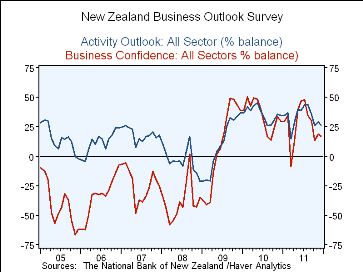
in March.The balance on Confidence declined from 34.5% in February
to -8.7% in March, while the balance of optimists regarding the activity
outlook declined from 36.6% in February to 14.7% in March. Both
measures continued to improve until July when the financial crisis in the
Euro Area began to spread from the periphery towards the core
countries Italy and, more recently, France. Since then, except for a
small rise in both measures in November there have been steady declines in
both measures. Confidence has declined from a balance of 47.6% in
July to 16.9% in December. The balance on the Activity Outlook has
declined from 43.7% in July to 25.7% in December. The percent
balances for Confidence and the Activity Outlook are shown in the first
chart.
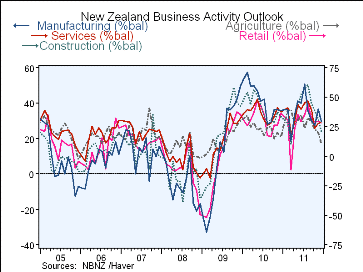
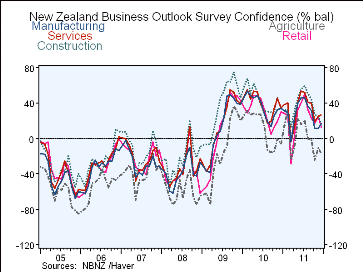
The Survey covers five industries: retail, agriculture, construction, services and manufacturing. Measures of Confidence and Activity Outlook for each industry are shown in the table below for the current year, and, in the two charts, for the past seven years. Those engaged in agriculture appear to be the least optimistic regarding confidence and the outlook. Confidence improved in December for the manufacturing and services industries. However, only the services industry showed an improvement in the outlook activity measure and that was only from 27.6% in November to 28.7% in December.
| New Zealand Business Outlook Survey | ||||||||||||
|---|---|---|---|---|---|---|---|---|---|---|---|---|
| Dec 11 | Nov 11 | Oct 11 | Sep 11 | Aug 11 | Jul 11 | Jun 11 | May 11 | Apr 11 | Mar 11 | Feb 11 | Jan 11 | |
| Business Confd (% Bal) | 16.9 | 18.3 | 13.2 | 30.3 | 34.4 | 47.6 | 46.5 | 38.3 | 14.2 | -8.7 | 34.5 | 29.5 |
| Mfg | 17.0 | 11.5 | 10.8 | 31.4 | 36.1 | 45.9 | 46.3 | 39.5 | 24.4 | -3.8 | 28.6 | 31.3 |
| Srvc | 26.7 | 24.7 | 19.3 | 38.5 | 41.0 | 51.9 | 53.3 | 41.3 | 14.6 | -3.2 | 40.7 | 37.8 |
| Const | 15.7 | 23.8 | 27.3 | 43.8 | 51.1 | 59.5 | 55.8 | 45.7 | 32.5 | 12.5 | 31.3 | 32.4 |
| Agrl | -17.9 | -10.9 | -24.5 | -1.9 | 0.0 | 20.9 | 16.3 | 22.5 | -8.9 | -22.6 | 33.3 | 13.6 |
| Retail | 12.0 | 25.3 | 16.9 | 22.4 | 32.9 | 49.2 | 40.0 | 32.4 | 5.6 | -28.4 | 25.9 | 27.8 |
| Activity Outlook (% Bal) | 25.7 | 28.8 | 26.1 | 35.4 | 43.3 | 43.7 | 38.7 | 39.7 | 29.5 | 14.7 | 36.6 | 34.5 |
| Mfg | 29.3 | 36.4 | 27.4 | 30.2 | 35.8 | 50.6 | 39.8 | 40.8 | 33.4 | 18.9 | 36.3 | 36.0 |
| Srvc | 28.7 | 27.6 | 23.3 | 39.3 | 46.4 | 45.0 | 39.7 | 43.4 | 29.4 | 18.0 | 40.9 | 39.2 |
| Const | 20.5 | 31.0 | 38.6 | 44.9 | 60.4 | 57.1 | 52.3 | 41.7 | 35.0 | 9.8 | 22.4 | 30.4 |
| Agrl | 10.2 | 19.6 | 22.5 | 29.6 | 32.7 | 23.3 | 34.7 | 30.6 | 26.8 | 38.9 | 38.8 | 27.4 |
| Retail | 28.3 | 29.6 | 28.6 | 31.7 | 43.9 | 35.2 | 29.4 | 35.1 | 22.9 | -11.1 | 30.8 | 33.6 |


