 Global| May 27 2008
Case-Shiller Home Price Index Declined Again
by:Tom Moeller
|in:Economy in Brief
Summary
The S&P/Case-Shiller Composite 20 home price index fell 2.2% m/m in March, continuing a decline of about that magnitude during each of the prior four months. This index of U.S. home prices has fallen in every month since its peak in [...]
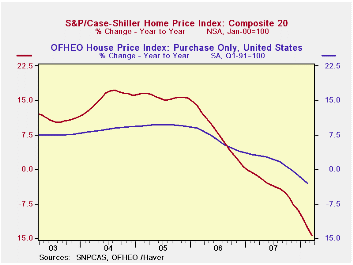
The S&P/Case-Shiller Composite 20 home price index fell 2.2% m/m in March, continuing a decline of about that magnitude during each of the prior four months. This index of U.S. home prices has fallen in every month since its peak in July of 2006 and the decline totals 16.6% during that period. The series dates back only to 2000.
For the first quarter overall, home prices fell 6.7% and that was the largest decline since the series peak in 2Q06. Year to year, 1Q prices were down 14.1%.
The Case-Shiller index of 20 U.S. cities and their surrounding
areas is not adjusted for the quality or the size of a home. The home
price index from the Office of Federal Housing Enterprise Oversight
(OFHEO), released last week, does make these adjustments. This series
indicates that during 1Q08 house prices were roughly unchanged y/y but
the purchase-only price index fell 3.1% y/y.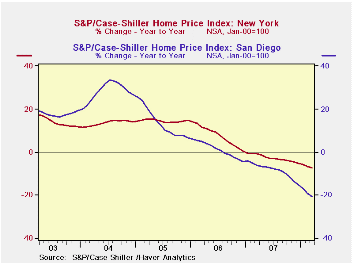
The Case-Shiller composite index of homes in 10 metropolitan areas has a longer history and dates back to 1987. This measure of prices fell 2.4% in March and was down 15.3% year-to-year.
Home prices in Las Vegas Nevada remained quite weak and were down 25.9% y/y. Prices in Miami were off 24.6% and home prices in Los Angeles were off 21.7%. In San Diego prices fell 20.5% but they were off a lesser 7.4% in New York and by 5.9% in Boston.
In Dallas prices also were off just moderately, 3.3% and they were up 0.8% in Charlotte, North Carolina.
The latest press release from Standard & Poor's can be found here. An overview of the S&P/Case-Shiller home price series can be found here.
The S&P/Case-Shiller home price series can be found in Haver's USECON database but the city data is in the REGIONAL database.
| S&P/Case-Shiller Home Price Index (NSA, Jan 00 = 100) | March | February | Y/Y | 2007 | 2006 | 2005 |
|---|---|---|---|---|---|---|
| 20 City Composite Index | 172.16 | 176.00 | -14.4% | -3.8% | 7.6% | 15.8% |

Tom Moeller
AuthorMore in Author Profile »Prior to joining Haver Analytics in 2000, Mr. Moeller worked as the Economist at Chancellor Capital Management from 1985 to 1999. There, he developed comprehensive economic forecasts and interpreted economic data for equity and fixed income portfolio managers. Also at Chancellor, Mr. Moeller worked as an equity analyst and was responsible for researching and rating companies in the economically sensitive automobile and housing industries for investment in Chancellor’s equity portfolio. Prior to joining Chancellor, Mr. Moeller was an Economist at Citibank from 1979 to 1984. He also analyzed pricing behavior in the metals industry for the Council on Wage and Price Stability in Washington, D.C. In 1999, Mr. Moeller received the award for most accurate forecast from the Forecasters' Club of New York. From 1990 to 1992 he was President of the New York Association for Business Economists. Mr. Moeller earned an M.B.A. in Finance from Fordham University, where he graduated in 1987. He holds a Bachelor of Arts in Economics from George Washington University.
More Economy in Brief

 Global| Feb 05 2026
Charts of the Week: Balanced Policy, Resilient Data and AI Narratives
by:Andrew Cates

