 Global| Nov 22 2005
Chain Store Sales Up
by:Tom Moeller
|in:Economy in Brief
Summary
The International Council of Shopping Centers (ICSC)-UBS survey indicated that last week, chain store sales recovered more than all of the prior period's decline with a 1.0% jump. It was the second w/w jump that strong this month and [...]
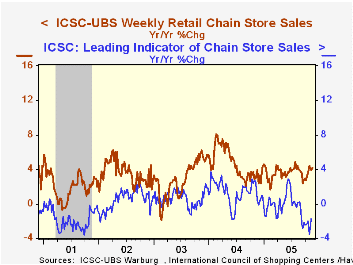
The International Council of Shopping Centers (ICSC)-UBS survey indicated that last week, chain store sales recovered more than all of the prior period's decline with a 1.0% jump. It was the second w/w jump that strong this month and it lifted the average level of sales in November 1.2% above October which rose 0.1% from September.
During the last ten years there has been a 51% correlation between the y/y change in chain store sales and the change in non-auto retail sales less gasoline, as published by the US Census Department. Chain store sales correspond directly with roughly 14% of non-auto retail sales less gasoline. The leading indicator of chain store sales from ICSC rose 0.6% (-1.7% y/y) during the latest week following a 0.2% increase the prior week. The ICSC-UBS retail chain-store sales index is constructed using the same-store sales (stores open for one year) reported by 78 stores of seven retailers: Dayton Hudson, Federated, Kmart, May, J.C. Penney, Sears and Wal-Mart.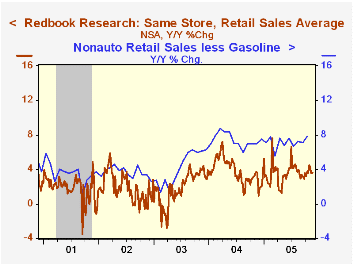
Through the second week of November, the Johnson Redbook survey indicated a lesser 0.2% (3.5% y/y) gain in store sales versus October. The survey tracks 15 stores and reflects same-store sales of retailers that account for roughly 85% of the department store category in the Census Bureau's monthly retail sales report.
During the last nine years there has been a 67% correlation between the y/y change in the Redbook store sales index and the change in non-auto retail sales less gasoline, as published by the US Census Department.
| ICSC-UBS (SA, 1977=100) | 11/19/05 | 11/12/05 | Y/Y | 2004 | 2003 |
|---|---|---|---|---|---|
| Total Weekly Chain Store Sales | 458.0 | 453.3 | 4.2% | 4.6% | 2.9% |
by Tom Moeller November 22, 2005
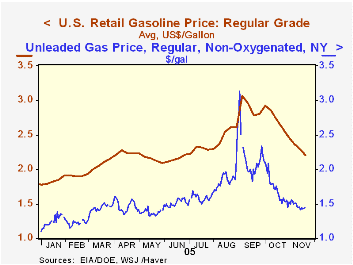
Last week, the US average retail gasoline price continued lower to $2.20 per gallon from $2.30 during the prior week and from $2.73 one month earlier. As of yesterday, the spot market price for gasoline was $1.44 per gallon and has roughly held that level for seven days.
Retail gasoline prices peaked in early September at $3.07 per gallon and have since fallen 72 cents or 28%. During that period spot gasoline prices are down $1.18 or 45%. The implied rise in gasoline retailers' margins has restored profitability. However, that rise in the retail price of gasoline versus the spot price followed several years of margin decline.
During the past month margins have fallen roughly 20%, in part reflecting a decline in gasoline demand of up to 3.5% versus the year ago level. In turn, lower prices seem to have revived demand which spiked last week and raised the four week average level of gasoline demand to roughly even with a year earlier after declining sharply through September & October. 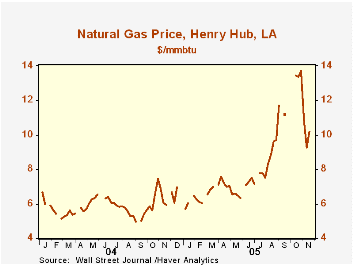
Crude oil prices have continued lower as well. WTI crude yesterday at $57.21 per barrel was down versus an average of $62.50 during October and was 18% lower than the late August high of $69.82.
In November, natural gas prices reversed some of the strength of the prior three months. During the last three weeks gas prices averaged $10.08/mmbtu versus the high of $13.53 averaged during October. Nevertheless, prices still are up 71% versus all of last year.
| Energy Prices | 11/21/05 | 12/31/04 | Y/Y | 2004 | 2003 | 2002 |
|---|---|---|---|---|---|---|
| US Retail Gasoline, Regular ($/Gal.) | $2.20 | $1.79 | 13.0% | $1.85 | $1.56 | $1.35 |
| Domestic Spot Market Price: West Texas Intermediate ($/Barrel) | $57.21 | $41.78 | 18.0% | $41.78 | $32.78 | $31.23 |
by Louise Curley November 22, 2005

Final results for Germany's third quarter Gross Domestic Product were released today. In addition to revisions of the preliminary estimates of total GDP released a week ago, details of the composition of both the expenditure and income sides of the national accounts are given. Estimates of the contribution to growth of the various sectors are also available and are shown in the table below for the first three quarters of 2005.
In the first chart we show the contribution of domestic demand and net exports to total GDP growth. Over the past five years changes in both net exports and domestic demand have been erratic and have tended to offset one another. In the last quarter, a positive contribution of 1.30 percentage points from net exports was offset by a negative contribution of 0.60 percentage points from domestic demand.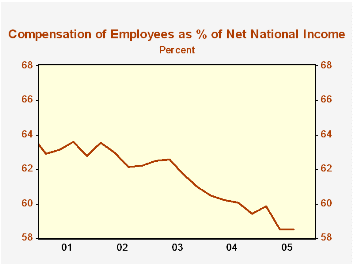
According to data on the income side of the National Accounts there has been a marked change in the distribution of income in Germany over the past five years. The share of compensation of employees in net national income has been declining over this period, as shown in the second chart. From 62.9% of net national income in the first quarter of 2001, employee compensation has declined to 58.5& in the third quarter of 2005. The counterpart to the decline in the share of compensation has been the rise in the share of entrepreneurial income (shown in the third chart) from 25.1% in the first quarter of 2001 to 29.1% in the third quarter of 2005. The changing distribution of income may account for a part of the sluggish trend in private consumption over this period.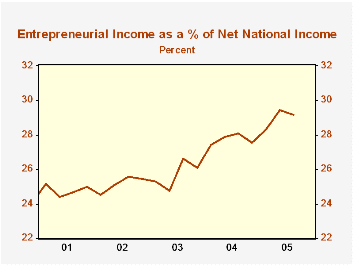
| Germany Contribution to Growth | Q3 05 % Pts | Q2 05 % Pts | Q1 05 % Pts |
|---|---|---|---|
| Growth of Gross Domestic Product | 0.70 | 0.0 | 0.10 |
| Net Exports | 1.30 | -1.00 | -0.50 |
| Domestic Demand | -0.60 | 0.90 | -0.40 |
| Consumption | -0.10 | 0.30 | -0.30 |
| Private | -0.10 | 0.00 | -0.60 |
| Government | 0.00 | 0.30 | 0.20 |
| Gross Fixed Investment | 0.20 | 0.10 | 0.10 |
| Inventories | -0.70 | 0.50 | -0.20 |
| Share of Net National Income | Q1 01 % | Q3 05 % | |
| Compensation of Employees | 62.9 | 59.5 | |
| Entrepreneurial Income | 25.1 | 29.1 |

Tom Moeller
AuthorMore in Author Profile »Prior to joining Haver Analytics in 2000, Mr. Moeller worked as the Economist at Chancellor Capital Management from 1985 to 1999. There, he developed comprehensive economic forecasts and interpreted economic data for equity and fixed income portfolio managers. Also at Chancellor, Mr. Moeller worked as an equity analyst and was responsible for researching and rating companies in the economically sensitive automobile and housing industries for investment in Chancellor’s equity portfolio. Prior to joining Chancellor, Mr. Moeller was an Economist at Citibank from 1979 to 1984. He also analyzed pricing behavior in the metals industry for the Council on Wage and Price Stability in Washington, D.C. In 1999, Mr. Moeller received the award for most accurate forecast from the Forecasters' Club of New York. From 1990 to 1992 he was President of the New York Association for Business Economists. Mr. Moeller earned an M.B.A. in Finance from Fordham University, where he graduated in 1987. He holds a Bachelor of Arts in Economics from George Washington University.
More Economy in Brief

 Global| Feb 05 2026
Charts of the Week: Balanced Policy, Resilient Data and AI Narratives
by:Andrew Cates

