 Global| Dec 07 2005
Challenger Layoffs Up Third Straight Month in November
by:Tom Moeller
|in:Economy in Brief
Summary
Challenger, Grey & Christmas reported that job cut announcements in November rose for the third consecutive month. The 22.1% rise to 99,279 followed a 13.2% rise the prior month and pulled the three month average of job cut [...]
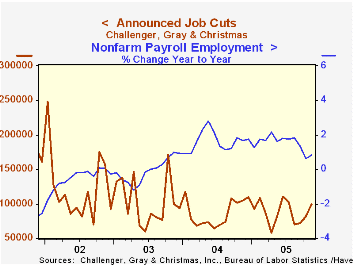
Challenger, Grey & Christmas reported that job cut announcements in November rose for the third consecutive month. The 22.1% rise to 99,279 followed a 13.2% rise the prior month and pulled the three month average of job cut announcements up to 84,139 (-19.7% y/y).
During the last ten years there has been an 84% (inverse) correlation between the three month moving average of announced job cuts and the three month change payroll employment.
Job cut announcements differ from layoffs. Many are achieved through attrition, early retirement or just never occur.
The aerospace (+251% y/y) and auto (+42% y/y) industries reported notable m/m increases in layoffs as did the financial (22.0% y/y) and the pharmaceutical (1,046% y/y) industries. These increases were somewhat offset by declines in retail (-31.8% y/y) and telecommunications (-71.2% y/y).
Challenger also reported that announced hiring plans rose sharply (413.8% y/y) for the second consecutive month.
| Challenger, Gray & Christmas | Nov | Oct | Y/Y | 2004 | 2003 | 2002 |
|---|---|---|---|---|---|---|
| Announced Job Cuts | 99,279 | 81,301 | -5.0% | 1,039,175 | 1,236,426 | 1,431,052 |
by Tom Moeller December 7, 2005
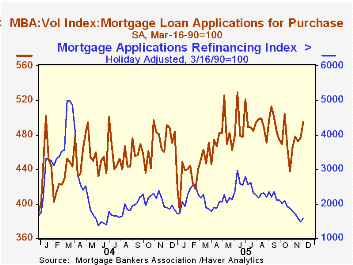
According to the Mortgage Bankers Association, the 5.2% rise in the total number of mortgage applications last week recovered virtually all of the prior two weeks' decline. Nevertheless, the rebound left the recent level 26% below the peak in early June.
The performance ofpurchase applications is consistent with a topping, but not at all a collapse, in the housing market. Purchase applications rose 4.0% last week and added to a several weekly gains during November. The latest lifted the level 4.7% ahead of the November average which had inched up 0.8% from October.
Purchase applications nevertheless remain 5% below the Spring peak. During the last ten years there has been a 49% correlation between the y/y change in purchase applications and the change in new plus existing single family home sales.
A 7.6% w/w rise in applications to refinance recovered the sharp decline of the prior week but applications had fallen hard for six successive weeks and the latest level was down 2.8% from the November average. Versus the June peak, the latest level of refis is down 46%.
The effective interest rate on a conventional 30-year mortgage rose further last week to 6.58% from 6.44% the prior week. Rates averaged 6.52% in November and averaged 5.81% in June. The effective rate on a 15-year mortgage also rose to 6.18% from 6.04%. The interest rates on 15 and 30 year mortgages are closely correlated (>90%) with the rate on 10 year Treasury securities.
The Mortgage Bankers Association surveys between 20 to 35 of the top lenders in the U.S. housing industry to derive its refinance, purchase and market indexes. The weekly survey accounts for more than 40% of all applications processed each week by mortgage lenders. Visit the Mortgage Bankers Association site here.
Trends in Home Ownership from the Federal Reserve Bank of St. Louis can be found here.
| MBA Mortgage Applications (3/16/90=100) | 12/02/05 | 11/18/05 | Y/Y | 2004 | 2003 | 2002 |
|---|---|---|---|---|---|---|
| Total Market Index | 656.7 | 624.1 | -5.7% | 735.1 | 1,067.9 | 799.7 |
| Purchase | 495.1 | 476.2 | 0.9% | 454.5 | 395.1 | 354.7 |
| Refinancing | 1,596.4 | 1,484.3 | -15.6% | 2,366.8 | 4,981.8 | 3,388.0 |
by Carol Stone December 7, 2005
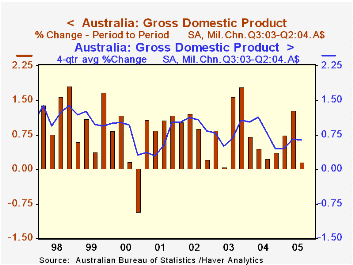
The Australian economy expanded a mere 0.2% in Q3, according to data reported at midday today, Canberra time. This was the smallest quarterly increase in a year. Australian GDP data are expressed in chained A$, with fiscal 2004 as the reference year, Q3 2003 to Q2 2004. Press reports and market participants focused on the "slow" advance, and the A$ fell in foreign exchange markets.
However, Q2 growth was an outsized 1.3%, and as seen in the table below, included sizable gains in private fixed investment, 6.7%, and government consumption, 1.3%. Thus, the small Q3 result could mark a return to a more normal path, rather than a cyclical weakening. The investment item slowed to a 0.5% increase in Q3 and government spending decreased by 0.6%. Exports were also strong in both Q1 and Q2, so their shrinkage in Q3 could also be more a reaction to that strength than a turn toward a new trend. In the meantime, household consumption is growing fairly steadily, with 0.6% in both Q2 and Q3, making a 2.8% annualized rate for the first three quarters of this year.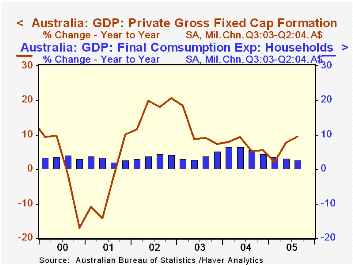
Even with the moderation in Q3, the capital formation figures highlight strength in business investment generally. Nonresidential buildings and other structures are up 24.5% from a year ago, showing 2005 as a rebound year after a slowdown last year to "only" 4.2% growth. Five-year expansion of those capital investments has run at an 8.7% annual rate. Machinery and equipment expenditures have had an erratic quarterly pattern, down in Q1, up 10.6% in Q2 and up a slim 1.5% in Q3, but they are running 15% above a year ago, close in line with 16% over the past four years.
Thus, despite the Q3 slowdown, the Australian economy looks vigorous, with growth in several diverse sectors. Obviously, though, as with all countries, prospects for the months ahead are clouded with the high cost of energy.
| Australia GDP Chain 2003/04 A$ |
Q3 2005 | Q2 2005 | Q1 2005 | From Q3 2004 | 2004 | 2003 | 2002 |
|---|---|---|---|---|---|---|---|
| Real GDP | 0.2 | 1.3 | 0.7 | 2.6 | 3.5 | 3.1 | 4.1 |
| Consumption: Households | 0.6 | 0.6 | 0.8 | 2.7 | 5.7 | 3.8 | 3.9 |
| Government | -0.6 | 1.3 | -0.1 | 1.6 | 3.7 | 3.7 | 3.1 |
| Private Fixed Capital Form. | 0.5 | 6.7 | -1.6 | 9.5 | 6.9 | 10.7 | 17.7 |
| Public Fixed Capital Form. | -5.2 | -0.2 | 1.5 | 0.2 | 13.1 | -0.8 | 5.9 |
| Exports | -2.3 | 2.0 | 1.0 | 2.6 | 4.0 | -2.2 | 0.0 |
| -Imports | -0.5 | 2.0 | 1.6 | 8.3 | 15.1 | 10.5 | 10.7 |
| Domestic Final Demand | 0.2 | 2.0 | 0.2 | 3.8 | 5.9 | 5.0 | 6.4 |
| Gross Value Added | 0.0 | 1.2 | 0.4 | 1.9 | 3.8 | 2.6 | 4.1 |

Tom Moeller
AuthorMore in Author Profile »Prior to joining Haver Analytics in 2000, Mr. Moeller worked as the Economist at Chancellor Capital Management from 1985 to 1999. There, he developed comprehensive economic forecasts and interpreted economic data for equity and fixed income portfolio managers. Also at Chancellor, Mr. Moeller worked as an equity analyst and was responsible for researching and rating companies in the economically sensitive automobile and housing industries for investment in Chancellor’s equity portfolio. Prior to joining Chancellor, Mr. Moeller was an Economist at Citibank from 1979 to 1984. He also analyzed pricing behavior in the metals industry for the Council on Wage and Price Stability in Washington, D.C. In 1999, Mr. Moeller received the award for most accurate forecast from the Forecasters' Club of New York. From 1990 to 1992 he was President of the New York Association for Business Economists. Mr. Moeller earned an M.B.A. in Finance from Fordham University, where he graduated in 1987. He holds a Bachelor of Arts in Economics from George Washington University.
More Economy in Brief

 Global| Feb 05 2026
Charts of the Week: Balanced Policy, Resilient Data and AI Narratives
by:Andrew Cates

