 Global| Aug 24 2020
Chicago Fed National Activity Index Moderates in July
Summary
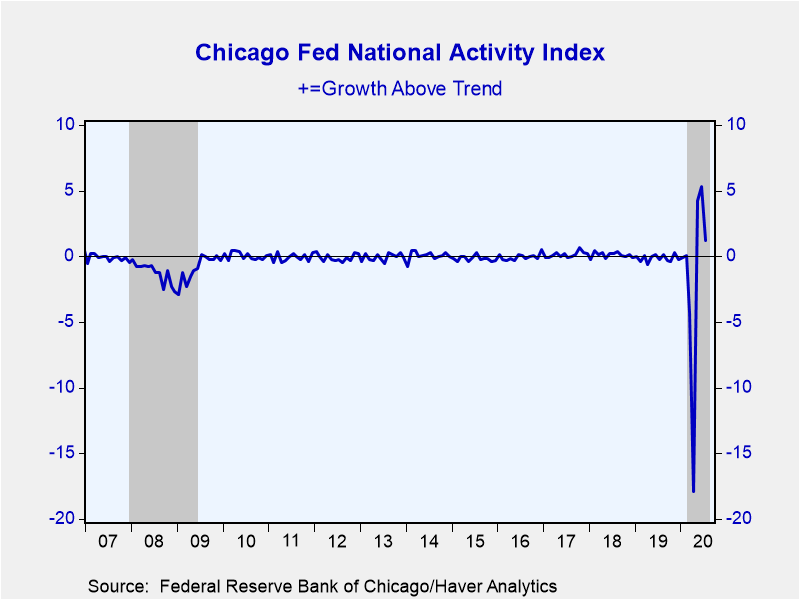
• Activity index declines to 1.18 in July. • Production and income indicators led the gain. Sales, orders and inventories decline. The Federal Reserve Bank of Chicago's National Activity Index decreased to 1.18 in July from an [...]
• Activity index declines to 1.18 in July.
• Production and income indicators led the gain. Sales, orders and inventories decline.
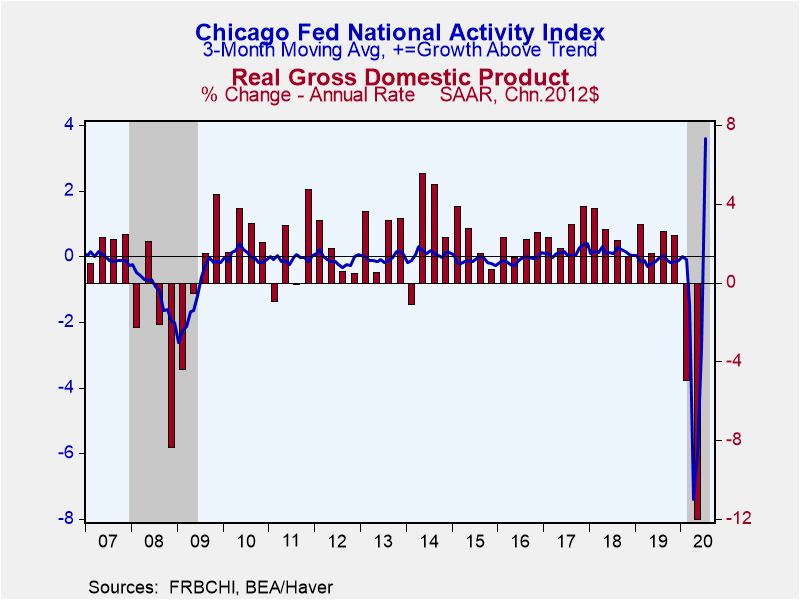
The Federal Reserve Bank of Chicago's National Activity Index decreased to 1.18 in July from an upwardly-revised 5.33 in June (was 4.11). This data suggests a moderation in activity after a bounce in late spring. The three-month moving average, which smooths out volatility in the monthly figures though is less important at the moment because of changing conditions, improved to 3.59 from -2.78. During the last 20 years there has been a 78% correlation between the Chicago Fed Index and the quarter-on-quarter real GDP growth.
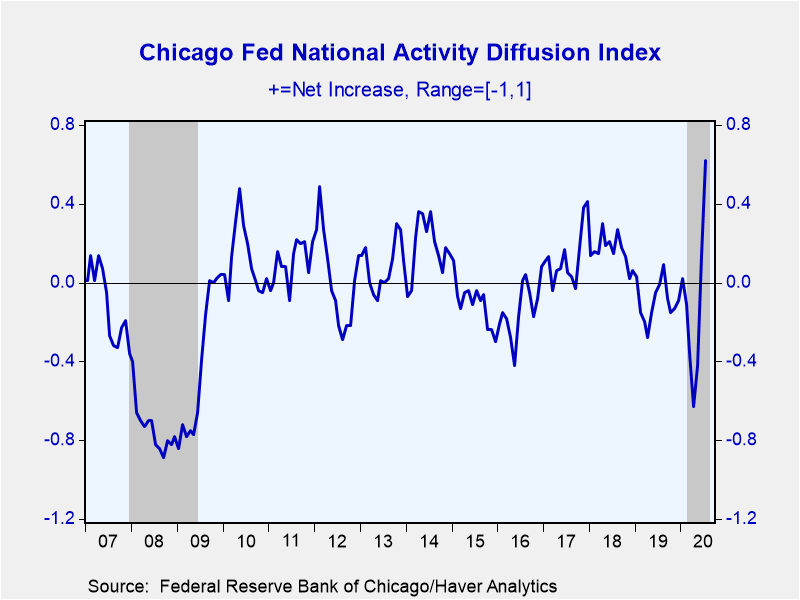
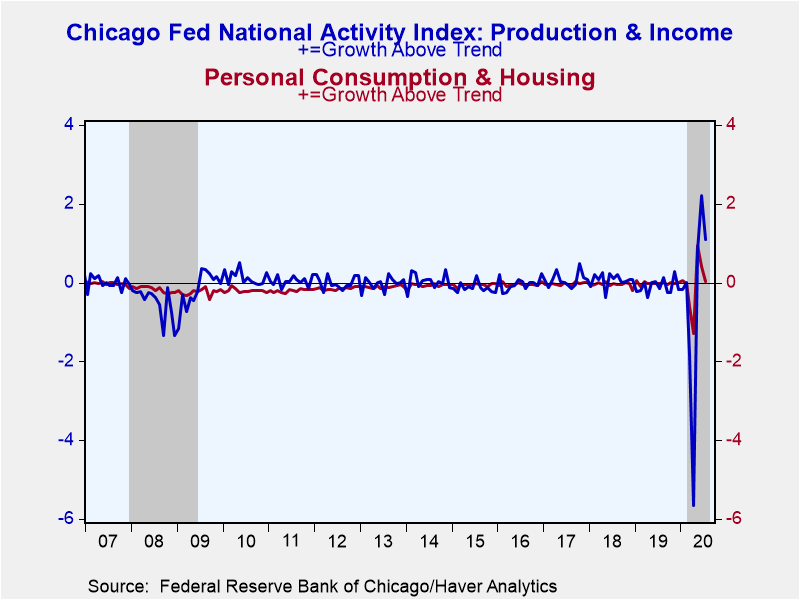
Three out of four of the contributing sectors increased in July led by the production and income indicators, which contributed 1.09 points to the gain. The diffusion index, which measures the breadth of movement in the monthly series, increased to 0.62 as 56 out of the 85 components improved.
The CFNAI is a weighted average of 85 monthly indicators of national economic activity. It is constructed to have an average value of zero and a standard deviation of one. Since economic activity tends toward trend growth rate over time, a positive index reading corresponds to growth above trend and a negative index reading corresponds to growth below trend.
These figures are available in Haver's SURVEYS database.
| Federal Reserve Bank of Chicago | Jul | Jun | May | Jul '19 | 2019 | 2018 | 2017 |
|---|---|---|---|---|---|---|---|
| National Activity Index (+ = Growth Above Trend) | 1.18 | 5.33 | 4.24 | -0.24 | -0.14 | 0.12 | 0.13 |
| Production & Income | 1.09 | 2.21 | 0.82 | -0.16 | -0.10 | 0.07 | 0.06 |
| Employment, Unemployment & Hours | 0.38 | 1.94 | 1.71 | 0.02 | 0.01 | 0.08 | 0.06 |
| Personal Consumption & Housing | 0.02 | 0.42 | 0.93 | -0.03 | -0.02 | -0.05 | -0.03 |
| Sales, Orders & Inventories | -0.31 | 0.77 | 0.78 | -0.06 | -0.03 | 0.01 | 0.04 |
| 3-Month Moving Average | 3.59 | -2.78 | -6.00 | -0.04 | -- | -- | -- |
| Diffusion Index | 0.62 | 0.14 | -0.42 | -0.01 | -0.10 | 0.16 | 0.13 |
Gerald D. Cohen
AuthorMore in Author Profile »Gerald Cohen provides strategic vision and leadership of the translational economic research and policy initiatives at the Kenan Institute of Private Enterprise.
He has worked in both the public and private sectors focusing on the intersection between financial markets and economic fundamentals. He was a Senior Economist at Haver Analytics from January 2019 to February 2021. During the Obama Administration Gerald was Deputy Assistant Secretary for Macroeconomic Analysis at the U.S. Department of Treasury where he helped formulate and evaluate the impact of policy proposals on the U.S. economy. Prior to Treasury, he co-managed a global macro fund at Ziff Brothers Investments.
Gerald holds a bachelor’s of science from the Massachusetts Institute of Technology and a Ph.D. in Economics from Harvard University and is a contributing author to 30-Second Money as well as a co-author of Political Cycles and the Macroeconomy.
More Economy in Brief
 Global| Feb 05 2026
Charts of the Week: Balanced Policy, Resilient Data and AI Narratives
by:Andrew Cates


