 Global| Jun 11 2012
China: An Interest Rate Reduction to the Rescue
Summary
The Central bank of China reduced its benchmark, one year lending rate 25 basis points to 6.31% and its one year deposit rate to 3.25% on June 7th. This was the first rate decrease since 2008. In the past few years, while inflation [...]
The Central bank of China reduced its benchmark, one year lending rate 25 basis points to 6.31% and its one year deposit rate to 3.25% on June 7th. This was the first rate decrease since 2008. In the past few years, while inflation was often a problem, China has used open market operations and changes in required reserve ratios to keep their economy on a relatively even keel. However, inflation as measured by the year to year change in the Consumer Price Index has fallen significantly since July 2011 from 6.1% to 3.0% in May of this year. With the threat of inflation easing, the Central Bank may be less reluctant to use interest rates to manage the ups and downs of the economy.
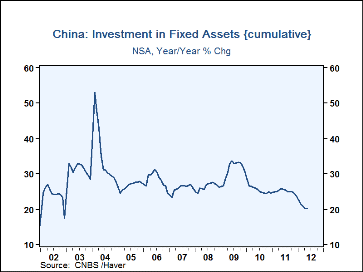
The slowdown in the Chinese economy that prompted the rate cut is evident in data on fixed investment, industrial production, retail sales and foreign trade. Although the year to year increase in fixed investment was 20% in May of this year, the monthly increase has been falling since May of 2011 when it was 25.8%, as can be seen in the first chart.
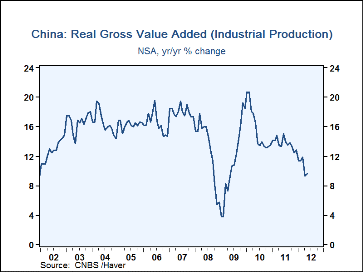
In China, Industrial Production is measured by Real Gross Value Added. In May, Real Gross Value Added was 9.6% above May, 2011, but here too, the year to year monthly increases have been declining, in this case, since June, 2011, when the year to year increase was 15.1%, as shown in the second chart.
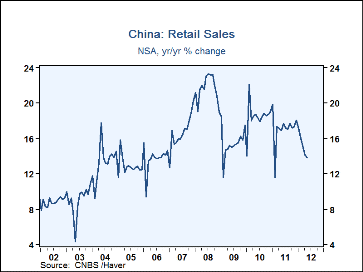
Retail sales held up better than fixed investment and industrial production, but they, too, have shown signs of decelerating since December of last year. From a year to year increase of 18.1% at that time, the year to year increase in May of this year was 13.8%, as shown in the third chart.
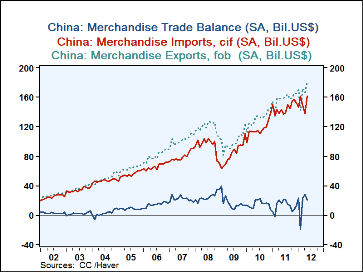
Finally, May's foreign trade data were encouraging. Although the increase in Imports, 17.1%, from April to May was greater than the increase in Exports, 9.6%, these were substantial increases.& Exports at $181.9 billion are at an all time high. Imports at $161.37 in May are only slightly below the all time high of $161.47 in February, 2012. These data are shown in the fourth chart and in the table below.
| May 12 |
Apr 12 |
May 11 |
M/M Chg |
Y/Y Chg |
2011 | 2010 | 2009 | |
|---|---|---|---|---|---|---|---|---|
| Exports (Billions US$) | 181.9 | 166.0 | 158.2 | 9.6% | 15.0% | 1890.3 | 1573.5 | 1193.0 |
| Imports (Billions US$) | 161.4 | 137.8 | 143.3 | 17.1% | 12.6% | 1742.0 | 1394.8 | 1001.3 |
| Balance (Billions US$) | 20.6 | 28.2 | 14.9 | -7.7 Bil $ | 5.7 Bil $ | 148.3 | 178.7 | 195.6 |
More Economy in Brief
 Global| Feb 05 2026
Charts of the Week: Balanced Policy, Resilient Data and AI Narratives
by:Andrew Cates


