 Global| Apr 10 2012
China's Manufacturing PMIs Are Pointing In Opposite Directions
Summary
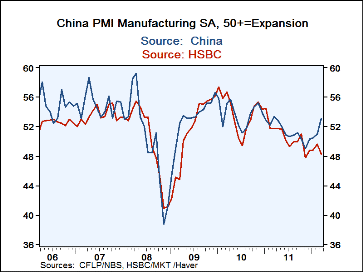
The March HSBC PMI for manufacturing in China was 48.3, below the 50 mark, suggesting a slowdown in the manufacturing sector. At the same time, the China Federation of Logistics and Purchasing reported their manufacturing PMI for [...]
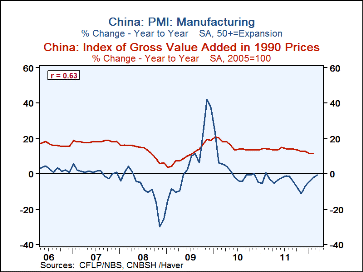
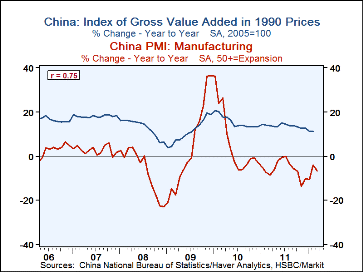
The March HSBC PMI for manufacturing in China was 48.3, below the 50 mark, suggesting a slowdown in the manufacturing sector. At the same time, the China Federation of Logistics and Purchasing reported their manufacturing PMI for March at 53.1 suggesting an expansion of manufacturing activity. The two PMIs have frequently differed in the past, both in magnitude and direction, as can be seen in the first chart. To see which one might be the better indicator we correlated the percentage change in each PMI with the percentage change in industrial production, and calculated the R2 , the determination ratio, which is a measure of how much of the variation in industrial production is explained by the variation in the PMI. The correlations are shown in the second and third charts. By this measure, the HSBC PMI is the better indicator, accounting for 56% of the variation in industrial production as opposed to the Chinese PMI that accounts for 39% of the variation in industrial production.
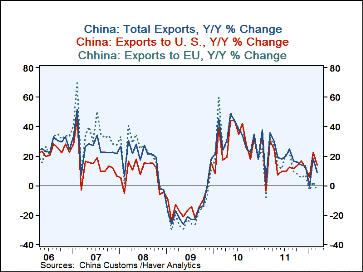
The trade data released today are more suggestive of a slowdown than an expansion. Total exports in March were 8.84% above a year ago, compared with year over year increases of 13% at the end of last year. Exports to the EU, China's best customer, have decelerated sharply and in March were 3.11% below March of a year ago. The year to year changes in China's goods exports are shown in the fourth chart.
| China: Exports of Goods (Y/Y %Change) | Mar'12 | Feb'12 | Jan'12 | Dec'11 | Nov'11 | Oct'11 |
|---|---|---|---|---|---|---|
| Total | 8.84. | 18.33 | -0.53 | 13.34 | 13.79 | 15.54 |
| To US | 14.03 | 22.59 | 5.49 | 11.93 | 16.97 | 13.87 |
| To EU | -3.11 | 2.25 | -3.21 | 7.21 | 4.96 | 7.54 |


