 Global| Aug 16 2010
China's Q2 GDP Tops Japan's For The Third Time
Summary
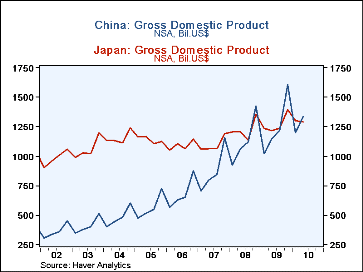
For the third time since December 2008 the seasonally unadjusted nominal gross domestic product of China has exceeded that of Japan as can be seen in the first chart. In the second quarter of this year, China reported GDP at $1337 [...]
For the third time since December 2008 the seasonally unadjusted nominal gross domestic product of China has exceeded that of Japan as can be seen in the first chart. In the second quarter of this year, China reported GDP at $1337 billion and Japan reported $1287 billion. The two previous occasions when China reported a GDP larger than that for Japan were the fourth quarters of 2008 and 2009.
The comparison is made between the unadjusted data for both countries as the adjusted data are not available for China. The China data can be found in the Haver Data bases, EMERGE or EMERGEPR and the Japan data in G10. We have used G10 for Japan, rather than the JAPAN data base because the former reports national accounts in US dollars while the latter does not.
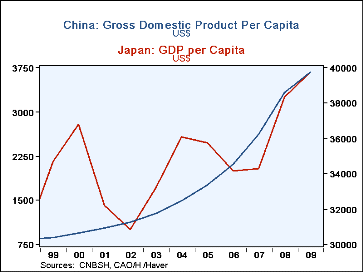
Although total Chinese GDP is gaining rapidly on that of Japan, per capita data show that China has a long way to go to approach the per capita GDP levels of Japan. In 2009. the latest year for which data are available, Japanese per capita GDP was almost $40,000 or more than ten times the $3,700 in China. The second chart shows per capita GDP for each country.
| Q2 10 | Q1 10 | Q4 09 | Q3 09 | Q2 09 | Q1 09 | Q4 08 | |
|---|---|---|---|---|---|---|---|
| GDP, (NAS, Bil US$) | |||||||
| China | 1337 | 1196 | 1602 | 1216 | 1147 | 1020 | 1420 |
| Japan | 1287 | 1299 | 1393 | 1231 | 1215 | 1235 | 1354 |
| 2009 | 2008 | 2007 | 2006 | 2005 | 2004 | 2003 | |
| GDP PER CAPITA (US$) | |||||||
| China | 3678 | 3325 | 2617 | 2115 | 1761 | 1490 | 1275 |
| Japan | 39754 | 38323 | 342811 | 34151 | 35731 | 36089 | 33206 |
More Economy in Brief
 Global| Feb 05 2026
Charts of the Week: Balanced Policy, Resilient Data and AI Narratives
by:Andrew Cates


