 Global| Mar 10 2008
China's Surplus on Total Trade in Goods Down Sharply in February But Less So With the U.S.
Summary
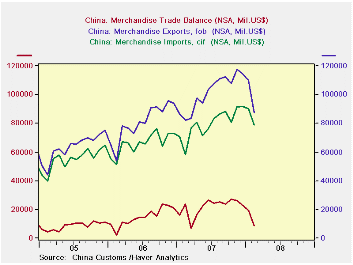
China's balance on trade in goods declined substantially in February to $8.6 billion from $19.5 billion in January. Both exports and imports declined; the former by 20% and the latter by 13%. The unadjusted figures are shown in the [...]

China's balance on trade in goods declined substantially in
February to $8.6 billion from $19.5 billion in January. Both exports
and imports declined; the former by 20% and the latter by 13%. The
unadjusted figures are shown in the first chart. Part of the declines
in exports and imports may have resulted from the extreme weather
conditions which disrupted transportation. In addition, the variable
occurrence of the Chinese New Year always introduces anomalies in
Chinese statistics at the beginning of the year.
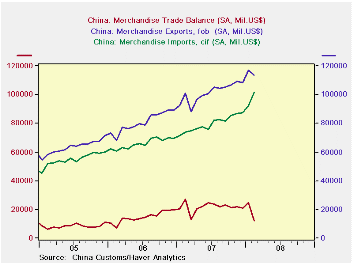
Haver Analytics adjusts the data for seasonal factors and the occurrence of the Chinese New Year. These adjusted data are shown in the second chart. Even with seasonal adjustment, the decline in the balance of trade remains significant. The seasonally adjusted exports show a decline, the seasonally adjusted imports show a substantial rise.
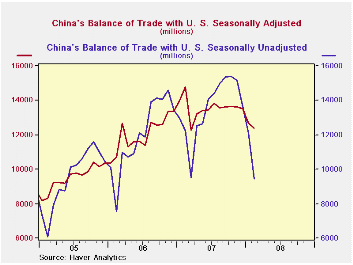
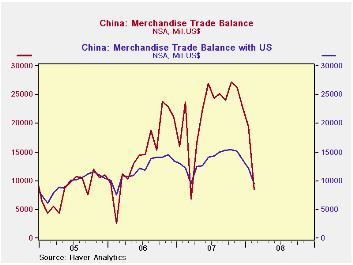
While the total trade balance shows a decline of over 50% for both the seasonally adjusted and the non adjusted data for February, the balance of trade with the U. S. showed a smaller decline of about 20% for the seasonally adjusted and unadjusted. On a seasonally adjusted basis Chinese exports to the U.S. were still positive. The third chart compares the Chinese balance of trade with the U.S. on a seasonally adjusted and an unadjusted basis. Finally the fourth chart compares the total Chinese surplus on trade with the surplus on trade with the U. S.


| CHINA TRADE DATA (Mil. US%) | Feb 08 | Jan 08 | Feb 07 | M/M %Chg | Y/Y %Chg | 2006 | 2005 | 2004 |
|---|---|---|---|---|---|---|---|---|
| Total Exports (NSA) | 87368 | 109655 | 82020 | -20.32 | 6.52 | 1218020 | 968935 | 461953 |
| Imports (NSA) | 78813 | 90174 | 58336 | -12.60 | 35.02 | 955821 | 791461 | 659953 |
| Balance (NSA) | 8555 | 19480 | 23694 | -56.07 | 63.89 | 262200 | 177474 | 102000 |
| Exports (SA) | 113616 | 116995 | 101012 | -289 | 12.48 | 1218020 | 968935 | 461953 |
| Imports (SA) | 101525 | 92259 | 73790 | 10.05 | 37.59 | 955821 | 791461 | 659953 |
| Balance (SA) | 12091 | 24741 | 27222 | -51.03 | -55.58 | 262200 | 177474 | 102000 |
| Exports to US Domestic (NSA) | 15478 | 19162 | 16336 | -19.22 | -5.25 | 232761 | 203512 | 162937 |
| Imports from US (NSA) | 6053 | 7068 | 4095 | -14.36 | 47.81 | 69861 | 59223 | 48735 |
| Balance (NSA) | 9425 | 12094 | 12241 | -22.07 | -23.06 | 162900 | 144289 | 114202 |
| Exports to US Domestic (SA) | 20599 | 19780 | 19888 | 4.14 | 3.58 | 232761 | 203512 | 162937 |
| Imports from US (SA) | 8185 | 7085 | 5113 | 15.55 | 60.09 | 69861 | 59223 | 48735 |
| Balance (SA) | 12414 | 15695 | 14776 | -20.90 | -15.99 | 162900 | 144289 | 114202 |


