 Global| May 10 2011
China's Trade Balance Increases: Exports Down $4.7 Billions But Imports Down $8.8 Billions
Summary
China's total trade surplus rose $4.7 billion from $14.2 billion in March to $18.9 billion in April. Although exports declined by $4.1 billion in April, imports declined even more--by $8.8 billion. The seasonally adjusted trade [...]
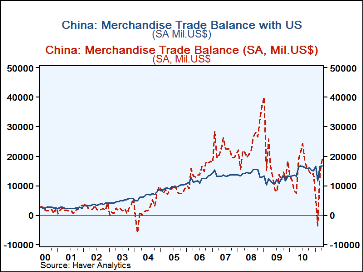
 China's total trade surplus rose $4.7 billion from $14.2 billion in March to $18.9 billion in April. Although exports declined by $4.1 billion in April, imports declined even more--by $8.8 billion. The seasonally adjusted trade surplus with the United States was $16.7 billion Both exports to and imports from the U. S were down slightly--exports by $0.7 billion and imports by $0.9 billion. The surplus with the United State continues to be the major factor in the overall surplus as can be seen in the first chart that compares the US surplus with the total surplus..
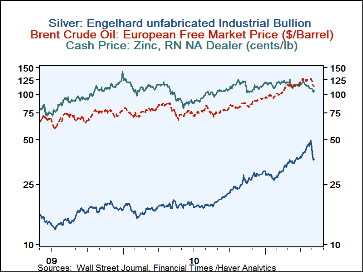
Imports are likely to be down again in May with the recent declines in the prices of many primary commodities that China imports. The daily prices of a few commodities important to China--oil, zinc and silver--are plotted in the second chart. The data are plotted on a log scale to show equal percent changes . The early May declines are striking. These declines are yet to be reflected in the monthly statistics.
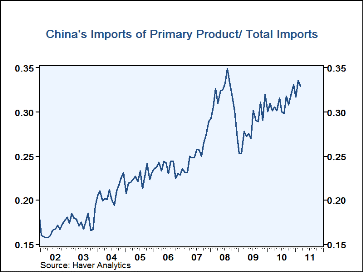
Primary products currently account for about one third of China's total imports, as can be seen in the third chart. The importance of primary product imports can be seen in the third chart which shows the ratio of primary product imports to total imports. Although the current ratio is below the peak of 35% reached in August, 2008, it has made a good recovery from the low point of 25% in February 2009.. ..
| Apr 11 | Mar 11 | Feb 11 | Jan 11 | Jan-Apr | |
|---|---|---|---|---|---|
| Total Exports (Billions USD, SA) | 155.9 | 160.0 | 126.1 | 165.6 | 555.3 |
| Total Imports | 137.0 | 145.8 | 129.7 | 160.3 | 545.0 |
| Balance | 18.9 | 14.2 | -3.6 | 5.3 | 34.8 |
| Exports to US (Billions USD, SA ) | 26.3 | 27.0 | 22.0 | 27.5 | 96.8 |
| Imports from US | 9.6 | 10.5 | 16.2 | 11.0 | 43.0 |
| Balance | 16.7 | 16.5 | 11.7 | 16.4 | 38.6 |
| Exports to US NSA (Billions USD, NSA) | 25.6 | 25.1 | 15.8 | 25.2 | 91.7 |
| Imports from US | 10.5 | 12.1 | 7.8 | 11.7 | 42.0 |
| Balance | 15.1 | 13.0 | 8.0 | 13.6 | 49.6 |
More Economy in Brief
 Global| Feb 05 2026
Charts of the Week: Balanced Policy, Resilient Data and AI Narratives
by:Andrew Cates


