 Global| Jul 11 2011
China/US Trade Balance at Record High in June
Summary
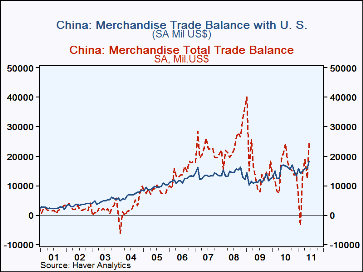
The balance of trade in Chinese goods with the United States was $17.9 billion in June, the highest monthly value on record. Chinese exports to the U.S. rose 5.1% from $25.8 billion in May to $27.1 billion in June while imports [...]
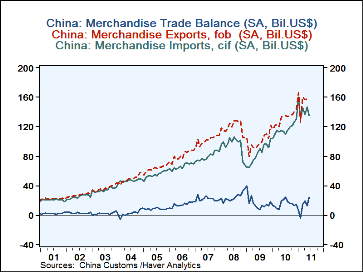
The balance of trade in Chinese goods with the United States was $17.9 billion in June, the highest monthly value on record. Chinese exports to the U.S. rose 5.1% from $25.8 billion in May to $27.1 billion in June while imports declined 13.% from $10.6 billion in May to $9.2 billion in June. Balances on trade with the U. S. and total Chinese trade are shown in the first chart. So far this year the pattern of total Chinese foreign trade has been more erratic than the trade with the U. S, as can be seen in the first chart. From a surplus of $13.9 billion in December, the total balance of trade fell to a deficit of $3.6 billion in February and since varied from a low of $12.3 billion in May to $24.0 billion in June. Total exports, imports and balances are shown in the second chart.
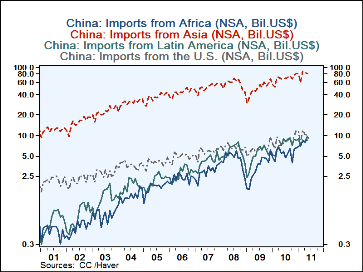
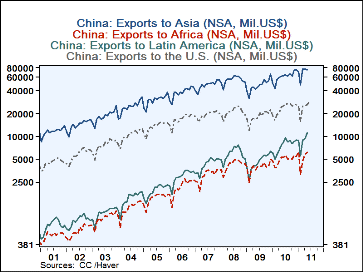
While trade with the United States and Asia still accounts for most of China's trade, trade with Africa and Latin America has been growing fast, the third and fourth charts compare the growth of exports and imports to and from Africa and Latin America with those to and from the U. S. and Asia. The data are plotted on a log scale facilitating comparisons of growth trends. Except for the U. S. and the Euro Area, June data are not yet available for the remaining countries and areas. As of May, China was running a trade deficit with Africa and a trade surplus with Latin America.
| June 11 | May 11 | June 10 | M/M % | Y/Y % | 2010 | 2009 | 2008 | |
|---|---|---|---|---|---|---|---|---|
| Trade with U. S. (Bil US$) | ||||||||
| Exports | 27.1 | 25.8 | 24.8 | 5.1 | 9.5 | 281.8 | 220.0 | 251.5 |
| Imports | 9.2 | 10.6 | 8.1 | -13.0 | 14.0 | 101.5 | 77.3 | 81.8 |
| Balance | 17.9 | 15.2 | 16.7 | 2.7* | 1.3* | 180.3 | 142.7 | 170.0 |
| Total Trade .(Bil US$) | ||||||||
| Exports | 159.0 | 158.5 | 135.0 | 0.3 | 17.8 | 1571.5 | 1195.9 | 1428.0 |
| Imports | 135.0 | 146.2 | 113.7 | -7.6 | 18.7 | 1390.5 | 948.7 | 1124.6 |
| Balance | 24.0 | 12.3 | 21.3 | 11.7* | 2.7* | 181.0 | 197.1 | 293.4 |
| May11 | April 11 | May 10 | M/M % | Y/Y % | 2010 | 2009 | 2008 | |
| Trade with Africa U. S. (Bil US$) | ||||||||
| Exports | 6.2 | 5.8 | 5.3 | 7.58 | 17.1 | 60.0 | 47.7 | 50.9 |
| Imports | 8.7 | 8.3 | 5.4 | 5.28 | 61.0 | 66.9 | 43.2 | 55.9 |
| Trade with L. A. (Bil US$) | ||||||||
| Exports | 11.0 | 9.4 | 7.7 | 17.56 | 43.52 | 91.8 | 57.1 | 71.5 |
| Imports | 9.7 | 7.8 | 7.2 | 24.32 | 35.6 | 91.1 | 64.0 | 71.4 |
| * Percentage points. | ||||||||


