 Global| Apr 11 2006
Commodity Prices in the News and in Haver
Summary
Commodity prices--agricultural, industrial, and precious metals--are exploding.Questions regarding the pros and cons of continued rises in many commodities are beginning to appear in the economic news columns. Haver has a wealth of [...]

Commodity prices--agricultural, industrial, and precious metals--are exploding.Questions regarding the pros and cons of continued rises in many commodities are beginning to appear in the economic news columns.
Haver has a wealth of price and related data for tracking the daily movements of several individual commodities and indexes of groups of commodities. Most of the data can be found in the DAILY database under Prices. The data include material from the Commodity Research Bureau, Goldman Sachs, the Wall Street Journal, the Foundation for International Economic Research (FIBER) and the London Metal Exchange.Commodity indexes from the Journal of Commerce, Dow Jones and Standard and Poor's are also available.In addition to the daily data, commodity prices can also be found in the IFS database. These IFS data are monthly.
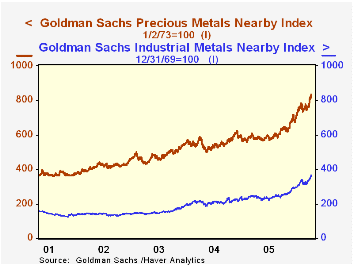
To illustrate the data, we have attached a number of charts. The first chart compares Goldman Sachs's indexes of industrial and precious metals, both of which have been making new highs. (We have based both indexes on a common base January 3, 1978=100). The index of industrial metals has, however, recently gone up faster than the index of precious metals, largely due to the sharp rise in copper and zinc prices.
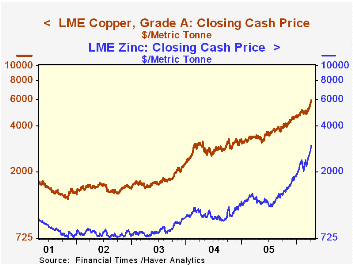
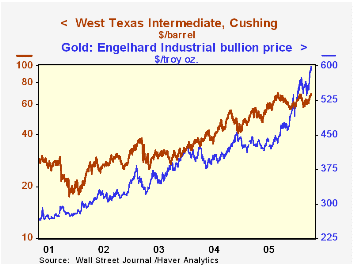
Daily cash prices for agricultural products, industrial metals and precious metals from the Wall Street Journal are found in the DAILY data base. Also found there are spot metal prices from the London Metal Exchange. In addition to prices, the London Metal Exchange provides estimates of the stocks of selected metals. The second chart shows the prices of copper and zinc from the London Metal Exchange and the third chart shows the prices of gold and oil taken from the Wall Street Journal data. Both the second and third charts have been plotted on log scales so that percentage changes in the prices of the two series are comparable. The price of zinc has been rising faster than that of copper and the price of gold has been rising faster than the price of oil in recent days. Over the past year the price of zinc has increased 117% to copper's 69% and the price of gold is up 40%, compared to 33% for oil.
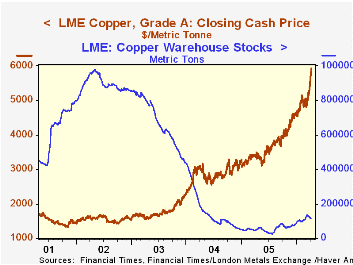
The final chart shows the price of copper on the London Metal Exchange against the estimate of world stocks of the metal. Stocks reached a low of 29,425 metric tons on July 6, 2005. Although they have since recovered, they are still almost 89% below the peak reached in May 2, 2002.
| Commodity Prices and Indexes | 4/10/06 | 4/03/06 | 4/12/05 | W/W % | Y/Y % |
|---|---|---|---|---|---|
| Goldman Sachs | |||||
| Industrial Metals | 342.86 | 336.23 | 239.21 | 1.97 | 43.33 |
| Precious Metals | 382.26 | 366.94 | 256.79 | 4.18 | 48.86 |
| Wall St. Journal | |||||
| Oil West Texas $ per bbl | 68.75 | 66.75 | 51.87 | 3.00 | 32.54 |
| Gold $ per troy oz | 598.90 | 588.15 | 428.68 | 1.83 | 39.71 |
| London Metal Exchange | |||||
| Copper $ per ton | 5920.75 | 5560.50 | 3496.75 | 6.48 | 69.32 |
| Zinc $ per ton | 2965 | 2726.75 | 1368.00 | 8.74 | 117.22 |
| LME Stocks of Metals | Current | Low7/06/05 | Peak5/02/02 | Current from Low | Current from Peak |
| Copper (Metric Tons) | 111,800 | 29,425 | 980,075 | 279.95 | -88.59 |
More Economy in Brief
 Global| Feb 05 2026
Charts of the Week: Balanced Policy, Resilient Data and AI Narratives
by:Andrew Cates


