 Global| Jul 25 2006
Consumer and Business Confidence Measures in France, Italy and the Netherlands
Summary
Italy and the Netherlands reported today on surveys of business and consumer confidence and France reported on business confidence. Despite slight dips in consumer confidence in the Netherlands and in business confidence in Italy, [...]

Italy and the Netherlands reported today on surveys of business and consumer confidence and France reported on business confidence. Despite slight dips in consumer confidence in the Netherlands and in business confidence in Italy, confidence measures in these three countries show improving trends
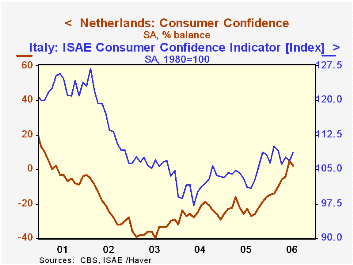
Consumers are still not very confident. In the Netherlands, the balance of optimists over pessimists dropped from 5% in June to 2% in July. What improvement that has taken place in the Netherlands has been due largely to a decline in the number of pessimists rather than an increase in optimists. In July 2005, the balance was -23%. Although there was an improvement in consumer confidence in Italy in July as the index of consumer confidence rose 1.7% from 89.5 (2000=100) in June to 91.0 in July, confidence continues well below the levels of 2000. (We have used the index function in the advanced functions to change the reported index base of 1980 to 2000) The first chart shows consumer confidence in Italy and the Netherlands.
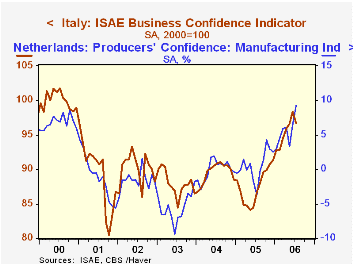
Business confidence, in contrast to that of consumers, has improved significantly over the past year. Although confidence in Italy dropped 1.6% in July from June, it was 11.5% above July, 2005. In the Netherlands, business confidence increased by 2.8 percentage points in July to 9.2% from 6.4% in June and was 12.9 percentage points above July, 2005. This is the highest percent balance on record and is above the recent peak of 8.2% in October, 2000. Measures of business confidence in Italy and the Netherlands are shown in the second chart.
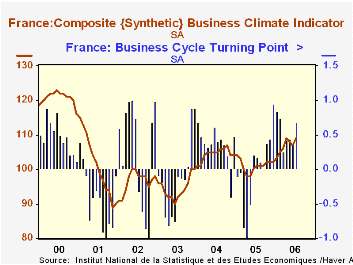
Business confidence also rose in France in July to 109 from 107 in June and from 101 in July, 2005. The French measure of business confidence is a composite of the balance of opinions on the following issues: production over the past three months, forecasts of production over the next three months, inventories, total order books, foreign order books and selling price expectations over the next three months. The indicator is constructed such that it has an average of 100 and a standard deviation of 10.
In addition to the business climate indicator INSEE (Institut Nationale de las Stastiques et des Etudes Economiques) also computes a qualitative indicator--Business Cycle Turning Point--that attempts to detect as soon as possible a turning point in the business cycle. The series tracks the difference between the probability that the economy is growing versus the probability that it is contracting. It is evaluated between -1 and +1. A value close to -1 suggests that the economy is contracting significantly; a value close to +1 suggests that the economy is expanding rapidly. A value close to 0 suggests that the economy is operating close to its long term growth rate. In July this indicator had a high value of .68, up from .36 in June and .17 in July, 2005. The Business Cycle Turning Point indicator and the Business Climate indicator are shown in the third chart.
| Measures of Confidence | Jul 06 | Jun 06 | Jul 05 | M/M Dif | Y/Y Dif | 2005 | 2004 | 2003 |
|---|---|---|---|---|---|---|---|---|
| The Netherlands | ||||||||
| Consumer % Balance | 2 | 5 | -23 | -3 | 25 | -22 | -25 | -35 |
| Business % Balance | 9.2 | 6.4 | -3.7 | 2.8 | 12.9 | 0.6 | -0.1 | -5.6 |
| Italy | ||||||||
| Consumer (2000=100) | 91.0 | 89.5 | 84.7 | 1.7* | 7.52* | 87.3 | 85.0 | 88.9 |
| Business (2000=100) | 96.7 | 98.3 | 86.7 | -1.6* | 11.5* | 87.5 | 89.5 | 88.0 |
| France | ||||||||
| Business Climate Indicator | 109 | 107 | 101 | 2 | 8 | 101 | 104 | 95 |
| Business Cycle Turning Point | 0.68 | 0.36 | 0.17 | 0.32 | 0.51 | -0.02 | 0.36 | -0.15 |
More Economy in Brief
 Global| Feb 05 2026
Charts of the Week: Balanced Policy, Resilient Data and AI Narratives
by:Andrew Cates


