 Global| Oct 23 2007
Consumer Confidence Holds Steady in October in the Netherlands and Italy
Summary
Consumer confidence held steady in the Netherlands and in Italy in October. The Dutch measure of consumer confidence had declined 16 percentage points in September, probably reflecting the turmoil in financial markets resulting from [...]

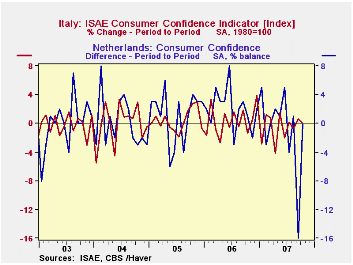
Consumer confidence held steady in the Netherlands and in Italy in October. The Dutch measure of consumer confidence had declined 16 percentage points in September, probably reflecting the turmoil in financial markets resulting from the disarray in the sub prime mortgage market in the U.S. The Italian consumer apparently, brushed off the trouble in the financial markets. Italian consumer confidence actually rose 0.7% in September to 89.9 (2000=1000) and remained there in October. The first chart shows the month to month changes in consumer confidence in the two countries. In the case of the Netherlands, the month to month changes are expressed in percentage point differences of the percent balance, and in Italy in percentage changes in an index number. The fact that the Dutch measure seems to be more volatile than that of the Italian, does not necessarily mean that the Dutch consumers are more volatile than their Italian counterparts. Percentage point changes in percent balances tend to be more volatile than percentage changes in an index number.
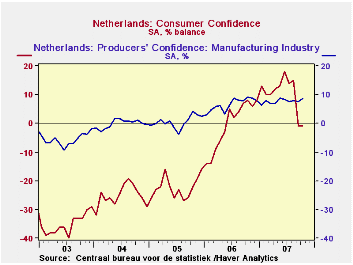
The Netherlands has also released its measure of business confidence today. Businessmen in the Netherlands have generally been more optimistic than consumers as can be seen in the second chart. Except for period from December 2006 through August of this year, business confidence has far been far higher than that of the consumer over the past five years. Business confidence increased in October to 8.6% from 7.5% in September.
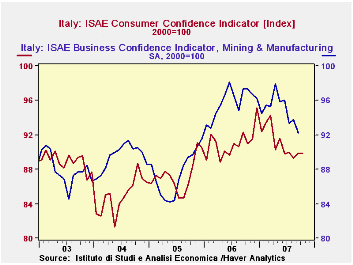
Italian business confidence will not be reported until later in the week, but the past trends of business and consumer confidence shows that businessmen, like those in the Netherlands tend to be more optimistic than consumers as can be seen in the third chart.
| CONSUMER AND BUSINESS CONFIDENCE | Oct 07 | Sep 07 | Oct 06 | M/M Chg | Y/Y Chg | 2006 | 2005 | 2004 |
|---|---|---|---|---|---|---|---|---|
| Netherlands (Percent Balance) | ||||||||
| Business Confidence | 8.6 | 7.5 | 9.0 | 1.1 | -0.4 | 6.7 | 0.6 | -0.1 |
| Consumer Confidence | -1 | -1 | 8 | 0 | -9 | -1 | -22 | -25 |
| Italy (2000=100) | ||||||||
| Business Confidence | n.a. | 92.2 | 97.3* | n.a. | -5.2 | 95.8 | 97.5 | 89.5 |
| Consumer Confidence | 89.9 | 89.9 | 91.0 | 0.0 | -1.3 | 91.1 | 87.3 | 85.0 |
| * September, 2006 | ||||||||
| n.a. not available | ||||||||
More Economy in Brief
 Global| Feb 05 2026
Charts of the Week: Balanced Policy, Resilient Data and AI Narratives
by:Andrew Cates


