 Global| Aug 08 2007
CPI Inflation Restrained in Czech Republic, Moderate in Lithuania and Very Fast in Latvia
Summary
Consumer price behavior varies widely in Central and Eastern Europe, apparently depending on the degree of development in various economies. In the Czech Republic, inflation is slow and restrained, much like that in Western Europe, [...]
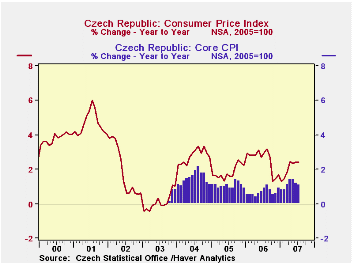
Consumer price behavior varies widely in Central and Eastern Europe, apparently depending on the degree of development in various economies. In the Czech Republic, inflation is slow and restrained, much like that in Western Europe, while Lithuania and Latvia show inflationary tendencies quite distinct from their larger regional neighbor. All three countries reported CPI data for July today.
In the Czech Republic, the total CPI was up just 0.3% in the month and 2.3% from July 2006. A measure of "core" prices, which excludes regulated prices and taxes, was up 0.2% in the month and 1.1% from a year ago. On a year-over-year basis, which is the easiest way to compare the three countries, health care, housing and alcohol have the largest increases in the Czech Republic, running about 3 to 4% for the first two, while alcohol is up 10.8%. Food prices are up 2.5%, an increase close to that in the overall index. Clothing, which had been declining, was unchanged in July from July 2006. Prices of recreational activities, communications and transportation are all down slightly from a year ago.
In Lithuania, the CPI in July was up 0.7% from June and 5.1% from a year ago. Food prices there have risen 10.3% year-to-year, in an acceleration that began last October. Housing costs are up 11.2%, also gaining more rapidly since last October. Restaurants and hotels see almost a double-digit increase, 9.8%. Other sectors have less extreme inflation, with prices of clothing and communications actually down from their year-ago levels. Home furnishings are up just 1.9%.
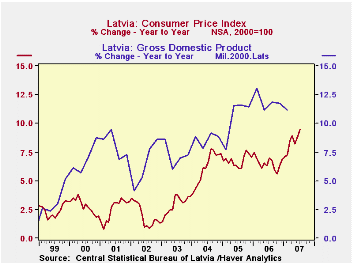
Inflation in Latvia runs an order of magnitude higher even than in Lithuania. Over the latest 12 months, it was 9.5%, including 1.6% in July from June. As in Lithuania, communications prices are down and clothing prices are the next weakest category. But food prices are up 12.2% in the past year and housing costs 15.1%. Restaurant prices and hotel rates went up 16.6%. Overall, the Latvian economy encompasses rapid real growth, more than 11% year-to-year in Q1, the latest figure. Employment then was 2.5% higher than a year ago and productivity (calculated by Haver as GDP per employee) gained an impressive 8.5%. Money growth, however, been very fast at 28.7% in Q2, although this is down from 40%+ expansion during 2006. The currency, the lat, is held steady with the euro, and the country's trade deficit is widening noticeably. Thus, Latvia appears to be a rapidly changing economy and persistent high inflation is part of the mix. 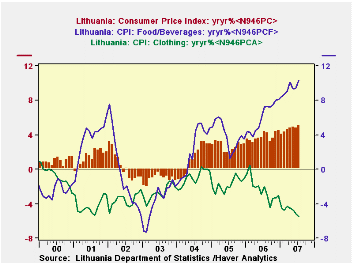
| CPI % Changes | July 2007 June 20072006 | 2005 | 2004 | ||||
|---|---|---|---|---|---|---|---|
| Mo/Mo | Yr/Yr | Mo/Mo | Yr/Yr | ||||
| Lithuania | 0.7 | 5.1 | 0.2 | 4.8 | 3.7 | 2.7 | 1.2 |
| Latvia | 1.6 | 9.5 | 1.0 | 8.8 | 6.5 | 6.8 | 6.2 |
| Czech Rep, Total | 0.29* | 2.3 | 0.29* | 2.5 | 2.5 | 1.8 | 2.8 |
| Core | 0.23 | 1.1 | 0.17 | 1.2 | 0.7 | 1.1 | 1.5 |
by Robert Brusca August 8, 2007
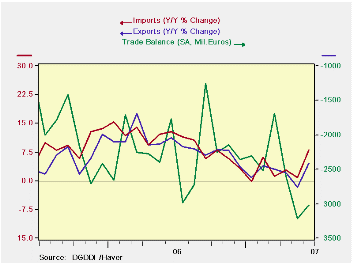
France trade deficit shrank in June compared to May but it still remained large. Quarter to quarter the deficit grew by €770mn. In Q2 French imports rose at a 12.1% pace compared to exports that rose by a scant 1.8% annual rate. The chart on the left shows that the reason for that is that exports slid deeper into the quarter than did imports although both rose sharply in June at quarter’s end.
In June export and import growth rates are strong across all main commodity categories. But over three months we see that import growth has been strong across the board on growth rates ranging from 11% to 27%. For exports, strong consumer goods export flows helped to compensate for weak capital goods and dropping motor vehicle exports.
A French spokesman blamed the persisting deficit on structural problems not on a too-strong euro.
| m/m% | % Saar | ||||
| Jun-07 | May-07 | 3M | 6M | 12M | |
| Balance* | -€€ 3,011.00 | -€€ 3,218.00 | -€€ 2,941.33 | -€€ 2,556.50 | -€€ 2,420.33 |
| Exports | |||||
| All Exports | 5.5% | -2.1% | 8.7% | 7.6% | 4.2% |
| Capital goods | 6.9% | -6.4% | 2.7% | 10.0% | 1.0% |
| Motor Vehicles | 3.4% | -2.4% | -1.9% | 9.4% | 1.8% |
| Consumer Goods | 4.7% | -0.6% | 22.0% | 1.7% | 4.9% |
| IMPORTS | |||||
| All Imports | 4.9% | -0.8% | 27.0% | 11.6% | 8.0% |
| Capital goods | 4.1% | 1.1% | 22.5% | 13.5% | 3.1% |
| Motor Vehicles | 6.1% | -0.5% | 18.8% | 18.6% | 14.7% |
| Consumer goods | 4.8% | -1.7% | 11.0% | 5.4% | 7.9% |
| *Mil euros; monthly or period average | |||||
by Robert Brusca August 8, 2007
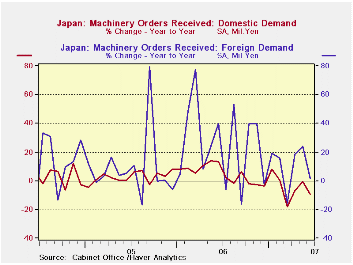
Foreign demand for core machinery orders has spiked up now and gain in Japan, but domestic demand has remained consistently weak.
The three month ‘spike’ in domestic machinery orders over three months is surprising. It mostly reflects a spike in April, with further growth in May offset by a drop in June. Over all core machinery orders, however, continue to show weakness Over three, six and twelve months core orders are contracting. The core orders figures exclude shipbuilding orders and electric power orders that tend to be lumpy and distort trends. Three-month trends for core orders are trying to make a comeback but so far the localized strength has not been able to move the six-month or Yr/Yr trends higher. On all tenors core orders are still declining.
| m/m % | Saar % | |||||
| SA | Jun-07 | May-07 | Apr-07 | 3-Mos | 6-Mos | 12-Mos |
| Total | -6.5% | 5.8% | 16.0% | 72.9% | 17.9% | -4.7% |
| Core Orders* | -10.4% | 5.9% | 2.2% | -11.8% | -16.8% | -18.2% |
| Foreign Demand | -5.9% | 5.5% | 8.1% | 32.7% | 49.0% | 1.7% |
| Domestic Demand | -6.5% | 5.9% | 20.1% | 100.0% | -1.0% | -9.3% |
| * Excl ships and electric power; mil of yen | ||||||
by Robert Brusca August 8, 2007
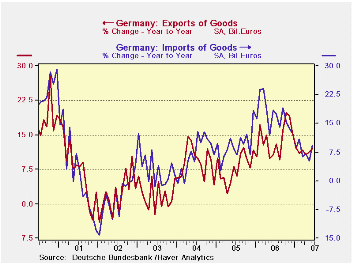
German trade trends are showing sharp wild swings in their interval growth rates. The trends on the accompanying chart show a more stable longer pattern from early 2006 through early mid-2007 import trends worked lower. Export trends worked lower from October 2006 through April of 2007. At mid-year German exports are showing some tendency for firmness while imports have jumped sharply. German chemical and machinery exports are continuing to hold up.
For the quarter exports have risen by 2.5% compared to a drop of 1.2% for imports. While these are nominal figures the inflation adjusted figures should show a contribution of net exports to GDP growth in 2007-Q2. But the surge in imports later in the second quarter could be laying the groundwork for a lasting import gain that could make net exports a drain on Q3 GDP. It is too soon to know about such things, but one thing Germany is continuing to look for is for the consumer sector to kick in to help out with second half growth. With the broad inflation adjusted euro at such a peak, more domestic demand help could be essential to maintaining the growth trend, especially if the import surge lasts.
| m/m% | % Saar | ||||
| Jun-07 | May-07 | 3M | 6M | 12M | |
| Balance* | €€ 14.88 | €€ 17.39 | €€ 16.04 | €€ 15.70 | €€ 15.30 |
| EXPORTS | |||||
| All Exports | 2.1% | -0.9% | 8.6% | 6.4% | 12.1% |
| Capital goods | -- | 1.0% | -6.6% | -6.5% | 9.4% |
| Motor Vehicles | -- | 3.4% | 1.9% | 14.0% | 7.7% |
| Consumer Goods | -- | -5.8% | -0.3% | 7.2% | 13.0% |
| IMPORTS | |||||
| All Imports | 6.7% | -3.6% | 15.8% | 6.0% | 9.2% |
| Capital goods | -- | -1.9% | -25.8% | -10.4% | 6.5% |
| Motor Vehicles | -- | 6.4% | 20.1% | 8.2% | 16.9% |
| Consumer goods | -- | -7.3% | -29.0% | -2.1% | 1.3% |
| *Billions of euros; monthly or period average; Shaded area trends lag one month | |||||
by Tom Moeller August 8, 2007
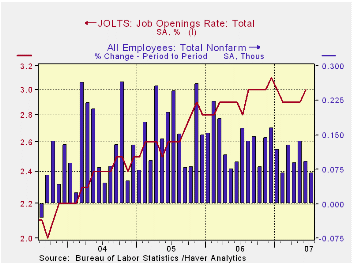
The Bureau of Labor Statistics reported in the Job Openings & Labor Turnover Survey (JOLTS) that the June job openings rate increased slightly from the prior month to 3.0%, the highest level since January. The job openings rate is the number of job openings on the last business day of the month as a percent of total employment plus job openings.
The actual number of job openings rose 5.1% m/m to 4.305 million (7.8% y/y). Private sector openings rose 5.6% (8.3% y/y) reflecting a 22.5% m/m jump in professional & business services (34.6% y/y). That made up a 29.9% (-34.5% y/y) drop in the number of construction jobs.
The hires rate fell m/m to 3.4%, its lowest level in three years. The hires rate is the number of hires during the month divided by employment.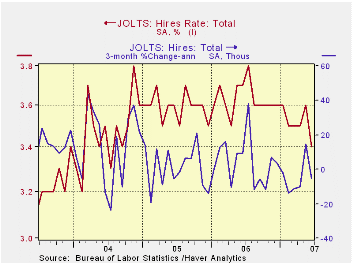
The actual number of hires decreased 4.6% (-4.7% y/y) to 4.752 million. Retail sector jobs fell by 15.7% (-19.3% y/y). Hires in the construction and the factory sectors offset each other with small changes.
The job separations rate in June was unchanged m/m at 3.3%. Separations include quits, layoffs, discharges, and other separations as well as retirements. The total separations, or turnover, rate is the total number of separations during the month divided by employment. The level of job separations fell a modest 0.7% (-3.0% y/y) from an upwardly revised level the prior month.
The survey dates only to December 2000 but has since followed the movement in nonfarm payrolls.
A description of the Jolts survey and the latest release from the U.S. Department of Labor is available here.
The FOMC in 1978 from the Federal Reserve Bank of St. Louis can be found here.
| JOLTS (Job Openings & Labor Turnover Survey) | June | May | June '06 | 2006 | 2005 | 2004 |
|---|---|---|---|---|---|---|
| Job Openings Rate: Total | 3.0% | 2.9% | 2.9% | 3.1% | 2.8% | 2.5% |
| Hires Rate: Total | 3.4% | 3.6% | 3.7% | 43.6% | 43.1% | 41.7% |
by Robert Brusca August 8, 2007
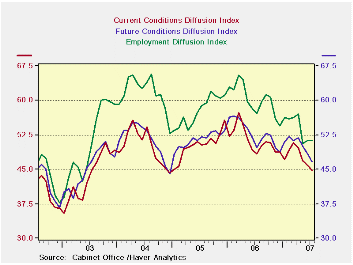
Trends for Japan’s economy-watchers index have turned lower and remain in a downtrend after having made a local peak between February and April, depending on the series. Even this local peak is part of an ongoing downtrend for the indexes whose true cycle peak dates to early 2006. Japan’s policy markets do look at this index and it is considered reliable. One attribute of the index is that it is timely. The current and future portions of the index are turning lower and each displays three straight months of declines. The employment index ‘triggered the slide’ with a huge drop three months ago followed by two months of begrudging gains. The index does tell a reassuring story of Japan’s growth.
| Raw readings of each survey | Percent of 5Yr range* | ||||||
| Jul-07 | Jun-07 | May-07 | Apr-07 | Jul-07 | Jun-07 | May-07 | |
| Diffusion | |||||||
| Economy Watchers | 44.7 | 46.0 | 46.8 | 49.7 | 3.8% | 25.7% | 44.4% |
| Employment | 51.2 | 51.2 | 50.7 | 57.1 | 4.0% | 27.5% | 35.6% |
| Future | 46.7 | 48.4 | 50.0 | 51.9 | 21.4% | 34.9% | 52.9% |
by Tom Moeller August 8, 2007
The total number of mortgage applications surged 8.1% last week following declines during the prior two weeks, according to the Mortgage Bankers Association.
Strongest was a 9.1% gain in applications to refinance which rose after a 1.8% increase during the prior week.
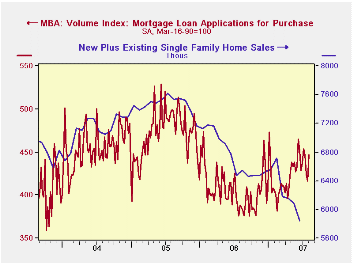
Purchase applications also were strong and rose 7.4%. The gain followed steady declines during five of the previous six weeks. It was to the highest level since early July.
During the last ten years there has been a 58% correlation between the y/y change in purchase applications and the change in new plus existing single family home sales.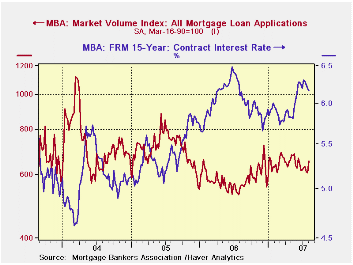
The effective interest rate on a conventional 30-year mortgage dropped a sharp ten basis points w/w to 6.74%, the lowest since early June. Rates averaged 6.91% during July, up from 6.28% in December. Rates for 15-year financing similarly fell sharply to 6.45% last week. Interest rates on 15 and 30 year mortgages are closely correlated (>90%) with the rate on 10 year Treasury securities.
During the last ten years there has been a (negative) 79% correlation between the level of applications for purchase and the effective interest rate on a 30-year mortgage.
The Mortgage Bankers Association surveys between 20 and 35 top lenders in the U.S. housing industry. Then it derives its refinance, purchase and market indexes. The weekly survey covers roughly 50% of all U.S. residential mortgage applications processed each week by mortgage banks, commercial banks and thrifts. Visit the Mortgage Bankers Association site here.
For yesterday's statement by the FOMC follow this link.
The U.S. Economy and Monetary Policy from the Federal Reserve Bank of San Francisco can be found here.
| MBA Mortgage Applications (3/16/90=100) | 08/03/07 | 7/27/07 | Y/Y | 2006 | 2005 | 2004 |
|---|---|---|---|---|---|---|
| Total Market Index | 656.5 | 607.1 | 18.7% | 584.2 | 708.6 | 735.1 |
| Purchase | 447.4 | 416.6 | 15.0% | 406.9 | 470.9 | 454.5 |
| Refinancing | 1,881.1 | 1,724.1 | 23.9% | 1,633.0 | 2,092.3 | 2,366.8 |
Carol Stone, CBE
AuthorMore in Author Profile »Carol Stone, CBE came to Haver Analytics in 2003 following more than 35 years as a financial market economist at major Wall Street financial institutions, most especially Merrill Lynch and Nomura Securities. She had broad experience in analysis and forecasting of flow-of-funds accounts, the federal budget and Federal Reserve operations. At Nomura Securities, among other duties, she developed various indicator forecasting tools and edited a daily global publication produced in London and New York for readers in Tokyo. At Haver Analytics, Carol was a member of the Research Department, aiding database managers with research and documentation efforts, as well as posting commentary on select economic reports. In addition, she conducted Ways-of-the-World, a blog on economic issues for an Episcopal-Church-affiliated website, The Geranium Farm. During her career, Carol served as an officer of the Money Marketeers and the Downtown Economists Club. She had a PhD from NYU's Stern School of Business. She lived in Brooklyn, New York, and had a weekend home on Long Island.


