 Global| Sep 17 2010
Credit Market Borrowing Begins To Expand; "Rest-of-World" Investors Provide Sizable Funding
Summary
Credit market borrowing grew $567 billion, seasonally adjusted annual rate, in Q2, stronger than the $498 billion amount in Q1. That figure, in turn, reflects a sizable revision of the tiny $10.3 billion paydown initially reported. [...]
Credit market borrowing grew $567 billion, seasonally adjusted annual rate, in Q2, stronger than the $498 billion amount in Q1. That figure, in turn, reflects a sizable revision of the tiny $10.3 billion paydown initially reported. These data are from the Federal Reserve's flow-of-funds dataset, published today for Q2. The entire array is contained in Haver's FFUNDS database. The Q1 revisions mainly impacted commercial banks, but they were spread across several sectors and did not change the impression of any specific sector's behavior.
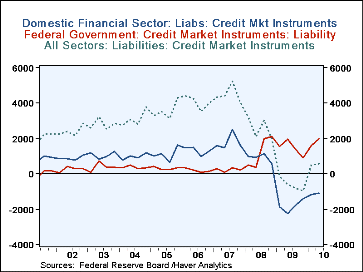
In Q2, the federal government expanded its borrowing markedly, raising a seasonally adjusted $2.0 trillion, up from $1.6 trillion in Q1, both figures also at annual rates. Among other nonfinancial borrowers, nonfarm corporate business raised $273 billion in Q2, following $369 billion in Q1. Households continued paying down debt, cutting $309 billion in Q2 after $232 billion in Q1. Noncorporate -- "small" -- business also continued to pull in, with net reductions of $256 billion and $302 billion in Q2 and Q1, respectively.
The financial sector also continues to pull in, on both the liability and the asset sides of their operations. Commercial banks contracted their lending by $575 billion in the latest period, and money market funds by $242 billion. While this was a larger cutback for the banks than the quarter before, it was the smallest reduction in credit from the money funds during this cycle.
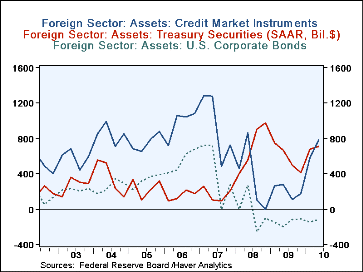
So who is providing credit to the U.S. economy? Through it all, the central bank has been by far the main support, although the Fed slowed dramatically in Q2, adding only $133 billion compared to $762 billion Q1 and still larger amounts across last year. Other infusions into the U.S. have come from the "rest of the world" sector. In fact, its lending accounted for more than the total lending in both quarters of this year, $783 billion in Q2 and $584 billion in Q1 (all figures still seasonally adjusted annual rates). And by far the largest asset foreign investors have acquired is Treasury securities, surpassing $700 billion-worth in Q2.
The pattern here of acquisition of financial assets by foreign investors fits the financial accounts side of the balance of payments data we discussed here yesterday. At a glance we can't reconcile the numbers exactly, but the magnitudes are very similar and indicate that "other", non-official, investors acquired a substantial volume of Treasury securities in Q2. Both flow-of-funds and balance-of-payments show that they liquidated "other" U.S. securities; the flow-of-funds detail indicates that they were moving out of corporate bonds and into equities over the past several quarters. Finally, that pattern is corroborated by the "TIC" data, the Treasury International Capital data, the underlying source for both of the broader compilations described here. These TIC data were also reported yesterday through July.
All of these datasets are available through Haver. As noted above, the flow-of-funds data are in Haver's FFUNDS database, while the balance of payments are in USECON and USINT, and the TIC data also in USINT.
| Flow of Funds(Y/Y % Chg.) | %Of Total Outstanding | Q2'10 | Q1'10 | 4Q'09 | End of Year | ||
|---|---|---|---|---|---|---|---|
| 2008 | 2007 | 2006 | |||||
| Total Credit Market Debt Outstanding | 100.0% | -0.9 | -1.3 | -0.3 | 4.8 | 10.3 | 9.9 |
| Federal Government | 16.6% | 20.4 | 21.3 | 22.7 | 24.2 | 4.9 | 3.9 |
| Households | 25.8% | -2.1 | -2.0 | -1.7 | 0.3 | 6.7 | 10.1 |
| Nonfinancial Corporate Business | 13.9% | 1.4 | 0.8 | 0.1 | 5.3 | 12.8 | 8.5 |
| Nonfarm, Noncorporate Business | 6.6% | -8.4 | -8.4 | -7.6 | 5.8 | 14.2 | 14.7 |
| Financial Sectors | 28.3% | -10.5 | -11.9 | -8.7 | 5.6 | 13.4 | 10.0 |
Carol Stone, CBE
AuthorMore in Author Profile »Carol Stone, CBE came to Haver Analytics in 2003 following more than 35 years as a financial market economist at major Wall Street financial institutions, most especially Merrill Lynch and Nomura Securities. She had broad experience in analysis and forecasting of flow-of-funds accounts, the federal budget and Federal Reserve operations. At Nomura Securities, among other duties, she developed various indicator forecasting tools and edited a daily global publication produced in London and New York for readers in Tokyo. At Haver Analytics, Carol was a member of the Research Department, aiding database managers with research and documentation efforts, as well as posting commentary on select economic reports. In addition, she conducted Ways-of-the-World, a blog on economic issues for an Episcopal-Church-affiliated website, The Geranium Farm. During her career, Carol served as an officer of the Money Marketeers and the Downtown Economists Club. She had a PhD from NYU's Stern School of Business. She lived in Brooklyn, New York, and had a weekend home on Long Island.
More Economy in Brief
 Global| Feb 05 2026
Charts of the Week: Balanced Policy, Resilient Data and AI Narratives
by:Andrew Cates


