 Global| Sep 13 2011
Declining Confidence Among Business Spreads to Australia
Summary
The National Australia Bank's, August survey of the business community, released today, shows that their measure of business confidence, a percent balance between optimists on the outlook and the pessimists, is now -7.7%, compared [...]
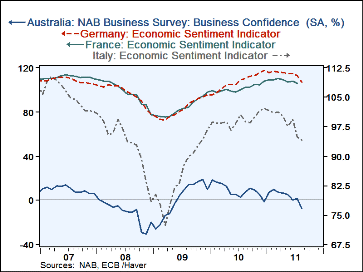
The National Australia Bank's, August survey of the business community, released today, shows that their measure of business confidence, a percent balance between optimists on the outlook and the pessimists, is now -7.7%, compared with 1.5% in July and a recent high of 19% in November, 2010. The Australian trend is similar to that in most countries of around the world. No doubt it is a consequence of the slowdown in the United States and the financial turmoil in the Euro Area.
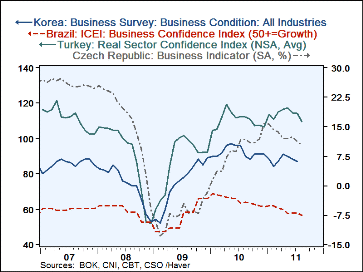
The first chart shows the declining trend in Australia's measure of confidence with those of other developed countries, Germany, France and Italy. There is a striking similarity in the trend of business confidence in the four countries The second chart shows business confidence measures for some of the emerging economies--the Czech Republic, Turkey, Brazil and South Korea. The business confidence measures for the Czech Republic, Turkey and Brazil are still positive, but trending downward. The Czech Republic measure which is a Percent Balance was 10.3% in August, indicating that the optimists exceeded the pessimists by 10.3%. but the excess was down from 15.6% in January. Similarly, Brazil's measure, which is a diffusion index where 50% is neutral, is in the positive range, but declining. Scores above 50% show positive confidence. However, Brazil's confidence has declined from 62.0% in January to 56.4% in August. Turkey's measure of confidence is also in positive territory 109.8 in August where 100 is neutral, but the index is down from 117.2 in May. The Korean measure of business confidence was below its neutral level of 100 in July and has be trending downward since late 2010.
The data in the attached charts and in the table below have been taken from a number Haver Data Bases. The Australian data are from Business Cycle Indicators and Surveys Section of the ANZ database and the data for France Italy and Germany, are from the Business Cycle Indicators and Surveys Section of the EUDATA database. Rather that using the data bases for each of the emerging countries, we used the EMERGE database and clicking on the Selected Major Indicators by Concept, we found several emerging countries under the Business Cycle Indicators and Surveys Concept.
| Business Confidence | Aug 11 |
Jul 11 |
Jun 11 |
May 11 |
Apr 11 |
Mar 11 |
Feb 11 |
Jan 11 |
|---|---|---|---|---|---|---|---|---|
| Australia (% Balance) | -7.7 | 1.5 | 0.0 | 5.5 | 6.9 | 7.2 | 9.8 | 7.6 |
| France (LT Avg=100) | N/A | 105.9 | 107.4 | 107.2 | 108.8 | 110.0 | 109.1 | 108.9 |
| Italy (LT Avg=100) | 94.1 | 94.8 | 99.3 | 97.5 | 100.2 | 101.2 | 101.1 | 101.6 |
| Germany (LT Avg=100) | 107.0 | 112.7 | 114.5 | 115.1 | 115.2 | 116.1 | 116.8 | 115.5 |
| Czech Republic (% Balance) | 10.3 | 11.3 | 12.3 | 12.0 | 11.9 | 13.6 | 14.1 | 15.6 |
| Turkey (Diffusion Index 100= Neutral) | 109.8 | 114.1 | 114.6 | 117.2 | 116.7 | 114.8 | 111.0 | 113.6 |
| Brazil (% > 50% Growth) | 56.4 | 57.9 | 57.9 | 57.5 | 59.7 | 60.7 | 61.8 | 62.0 |
| South Korea (Diffusion Index %) | N/A | 87 | 88 | 90 | 91 | 87 | 84 | 88 |
More Economy in Brief
 Global| Feb 05 2026
Charts of the Week: Balanced Policy, Resilient Data and AI Narratives
by:Andrew Cates


