 Global| Nov 29 2005
Denmark's Third Quarter GDP Growth Rate Tops That of Hungary and the Philippines
Summary
November is probably the busiest month for the release of economic growth estimates for the third quarter in individual countries. Today Gross Domestic Product data for Hungary, Denmark and the Philippines were released. Denmark's GDP [...]

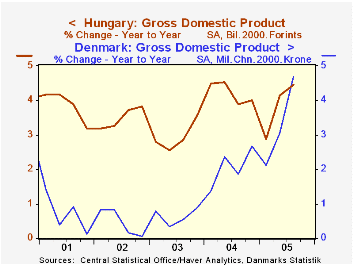
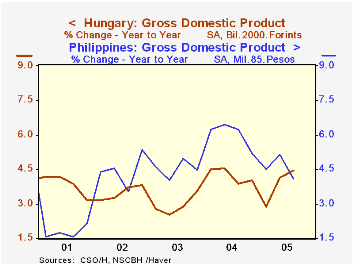
November is probably the busiest month for the release of economic growth estimates for the third quarter in individual countries. Today Gross Domestic Product data for Hungary, Denmark and the Philippines were released. Denmark's GDP was 4.70% above the third quarter of 2005, compared with 4.46% for Hungary and 4.09% for the Philippines. In terms of developed versus developing countries we have Denmark and Hungary in Europe. In terms of the location of developing countries we have Hungary in Eastern Europe and the Philippines in Asia.
First take a look at the year-to-year growth in the developed country, Denmark, and the developing country, Hungary--both in Europe--as shown in the first chart. Over the past five years until the third quarter of this year, Hungary has grown at a significantly higher rate than that of Denmark. In the third quarter, however, Denmark's growth rate was 4.70% compared with Hungary's, 4.46%. Not only has Denmark's growth rate exceeded that of Hungary in the third quarter, but since the second quarter of 2004, growth in Denmark, a non Euro Zone country, has been greater than that of the Euro Zone as a whole. The quarter-to-quarter growth rates so far this year show some weakness in Hungary in contrast to relatively steady advances in Denmark.
Now, contrast the year-to-year growth rates of the two developing countries in the second chart. The higher growth rate of the Philippines until this last quarter probably reflects the dynamism of the Pacific Rim economies versus the more subdued recoveries of the emerging countries of Eastern Europe. In the third quarter of this year, however, Hungary's economic grew 1% while that of the Philippines was virtually unchanged.
| Growth in Gross Domestic Product | Q3 05 % | Q2 05 % | Q1 05 % | 2004 % | 2003 % | 2002 % |
|---|---|---|---|---|---|---|
| Year-to Year | ||||||
| Denmark | 4.70 | 3.06 | 2.13 | 2.07 | 0.6 | 0.46 |
| Hungary | 4.46 | 4.15 | 2.88 | 4.23 | 2.94 | 3.50 |
| Philippines | 4.09 | 5.15 | 4.49 | 6.02 | 4.51 | 4.45 |
| Quarter-to-Quarter | ||||||
| Denmark | 1.39 | 1.60 | 0.54 | |||
| Hungary | 0.97 | 2.08 | -0.08 | |||
| Philippines | -0.02 | 2.20 | 1.27 |
More Economy in Brief
 Global| Feb 05 2026
Charts of the Week: Balanced Policy, Resilient Data and AI Narratives
by:Andrew Cates


