 Global| Sep 14 2009
Disappointing Retail Sales In New Zealand
Summary
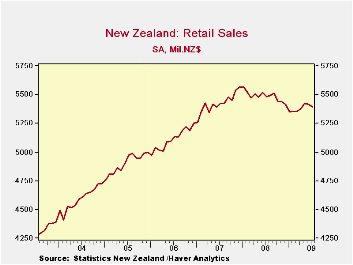
Retail sales in New Zealand fell 0.46% in July, contrary to expectations of a rise. Moreover, June sales were revised downward from a 0.1% increase to a 0.06% decline. The upturn in sales in April and May has fizzled out as can be [...]

Retail sales in New Zealand fell 0.46% in July, contrary to
expectations of a rise. Moreover, June sales were revised downward from
a 0.1% increase to a 0.06% decline. The upturn in sales in April and
May has fizzled out as can be seen in the first chart. Excluding motor
vehicles and related sales, sales were down 0.49% indicating that
vehicles and related sales increased slightly. Among the few other
areas where spending increased were fresh produce, clothing, and
recreation all of which represent relatively small portions of total
sales. Among the biggest losers were the more important supermarkets
and department stores, which declined 0.3% and 2.0% respectively .
.
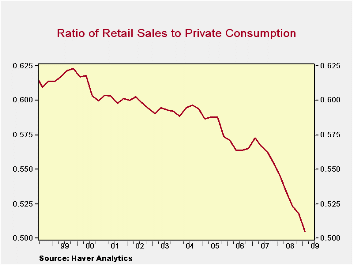
Retail sales have become a less reliable indicator of total consumption over the years as can be seen in the second chart that shows the ratio of retail sales to total private consumption in the National Accounts. In the last ten years the ratio has dropped from .62 to .51. New Zealand has yet to release national account data for the second quarter. In spite of their diminished importance in total consumption, the retail sales data suggest that consumption has added little to the economy in the second quarter and so far in the third quarter.
| NEW ZEALAND | Jul 09 | Jun 09 | Jul 08 | M/M % | Y/Y % | 2008 | 2007 | 2006 |
|---|---|---|---|---|---|---|---|---|
| Retail Sales (Millions NZ$) | ||||||||
| Total | 5392 | 6417 | 5485 | -0.46 | -1.70 | 65847 | 65071 | 61329 |
| Fresh Produce | 87 | 85 | 79 | 2.35 | 10.13 | 911 | 893 | 921 |
| Recreation | 203 | 196 | 188 | 3.57 | 7.98 | 2276 | 2358 | 2197 |
| Clothing | 212 | 209 | 221 | 1.44 | -4.07 | 2578 | 2594 | 2445 |
| Supermarkets | 1293 | 1297 | 1180 | -0.31 | 9.58 | 14369 | 13518 | 12587 |
| Department Stores | 299 | 305 | 329 | -1.97 | -912 | 3855 | 3770 | 3570 |
More Economy in Brief
 Global| Feb 05 2026
Charts of the Week: Balanced Policy, Resilient Data and AI Narratives
by:Andrew Cates


