 Global| May 03 2007
Driving Productivity Increases
Summary
A recently popular book on writing and grammar is titled "Eats, Shoots and Leaves". The title is ambiguous because the intent of the original writer of the phrase was to describes the diet of a particular animal: it "eats shoots and [...]

A recently popular book on writing and grammar is titled "Eats, Shoots and Leaves". The title is ambiguous because the intent of the original writer of the phrase was to describes the diet of a particular animal: it "eats shoots and leaves". But the addition of the comma alters the meaning dramatically.
A somewhat parallel situation derives from our title above, "Driving Productivity Increases". Punctuation has no role here, but the meaning is just as ambiguous. On a day when productivity data are reported for Q1, a reader of this website might well expect this discussion to concern factors that generated the rise in Q1 productivity. But Mr. Brusca has done that elsewhere here. Our subject is, instead, driving. Today, the Federal Highway Administration reported miles driven in March for the total US and the 50 states. After a simple description of these mileage figures, we will discuss "driving productivity", that is, the amount of output (GDP) per mile driven. It, like labor productivity, is rising. 
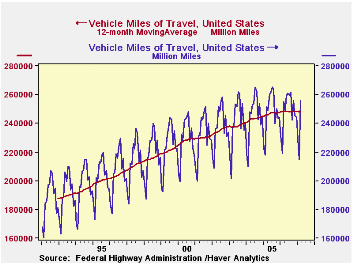
As seen in the first graph, total miles driven have flattened out. The 255.8 billion miles in March 2007 are a mere 0.3% above March 2006, and the 12-month moving average has declined outright by 0.2%. So people in the nation as a whole have restrained their driving.
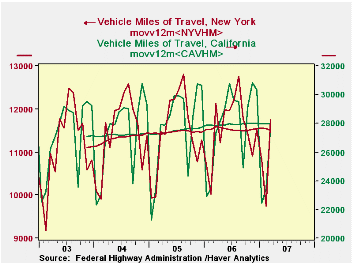
The pattern around the nation varies widely, however. We looked at the top four states for miles driven, California, Texas, Florida and New York. The individual state data only began in 2003, so there's no much history to go on. Miles driven continue to increase in California, but more slowly than at this time last year. The March 2007 figure is 1.4% above the year-earlier and averaged across 12 months to smooth the seasonality, it is up 0.6%. The 12 months through March 2006, in turn, had been up 1.8% on the year before. In New York, a similar pattern of slowing growth had been in place. But February and March each had a marked decline from year-ago amounts, 2.8% and 3.0%. And the 12-month moving average now shows a non-trivial decline as well, 0.7%, for the period ending in March. People are driving less in New York State. 
They are also driving less in Texas, somewhat unexpectedly. In Florida, miles driven are still increasing, but at a slower rate than before the run-up in gasoline prices. In both of these states, the March figure is a new monthly record, though. For the brief history we have, March seems to be a peak driving month during the year, although Texas has seen larger figures in the summer months of some years.
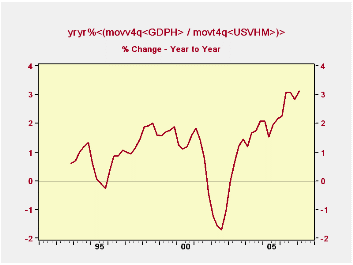
So what about "driving productivity". We compared GDP to mileage driven, calculating GDP per mile. As energy gets more expensive and people may be driving less, would that necessarily translate into weaker GDP. Is the US such a vehicle-dependent economy that it would suffer visibly by having to drive less? Encouragingly, over the last couple of years, this has not been the case. While some slowing may well result from this circumstance, it appears that more economical use of vehicles can offset at least some of the reduced driving volume. "Driving productivity increases" seems to be a statement of fact, not a misuse of words.
Total miles driven are contained in Haver's main USECON database. The state data are in REGIONAL. The graphs illustrate the new multiple series features of the upcoming version of DLXVG3 along with the manipulation of "Styles & Colors" to alter the colors of series from the "default" arrangement.
| Miles Traveled (Billions) | Mar 2007 | Feb 2007 | Jan 2007 | Year Ago | 2006 | 2005 | 2004 | 2000 |
|---|---|---|---|---|---|---|---|---|
| US | 255.8 | 215.0 | 229.1 | 255.0 | -- | -- | -- | -- |
| 12-mo Moving Average | 248.1 | 248.0 | 248.4 | 248.6 | 248.5 | 247.4 | 244.8 | 228.9 |
| California | 27.7 | 23.5 | 22.4 | 27.4 | 28.0 | 27.7 | 27.3 | -- |
| Texas | 21.3 | 17.9 | 18.4 | 21.0 | 19.6 | 19.5 | 19.0 | -- |
| Florida | 18.9 | 15.9 | 17.5 | 18.7 | 16.7 | 16.6 | 15.8 | -- |
| New York | 11.8 | 9.7 | 10.8 | 12.1 | 11.5 | 11.5 | 11.4 | -- |
| Memo: GDP/Mile | -- | 3.85(Q1) | -- | 3.74(Q1) | 3.83 | 3.72 | 3.64 | 3.57 |
Carol Stone, CBE
AuthorMore in Author Profile »Carol Stone, CBE came to Haver Analytics in 2003 following more than 35 years as a financial market economist at major Wall Street financial institutions, most especially Merrill Lynch and Nomura Securities. She had broad experience in analysis and forecasting of flow-of-funds accounts, the federal budget and Federal Reserve operations. At Nomura Securities, among other duties, she developed various indicator forecasting tools and edited a daily global publication produced in London and New York for readers in Tokyo. At Haver Analytics, Carol was a member of the Research Department, aiding database managers with research and documentation efforts, as well as posting commentary on select economic reports. In addition, she conducted Ways-of-the-World, a blog on economic issues for an Episcopal-Church-affiliated website, The Geranium Farm. During her career, Carol served as an officer of the Money Marketeers and the Downtown Economists Club. She had a PhD from NYU's Stern School of Business. She lived in Brooklyn, New York, and had a weekend home on Long Island.
More Economy in Brief
 Global| Feb 05 2026
Charts of the Week: Balanced Policy, Resilient Data and AI Narratives
by:Andrew Cates


