 Global| Mar 21 2006
Early Indicators Pointing to Good First Quarter for Finland
Summary
Indicators released today are pointing to an increase in the rate of growth of Finland's GDP in the first quarter from the 0.91% rate of the fourth quarter of 2005. The trend of the monthly total production series, which is a good [...]

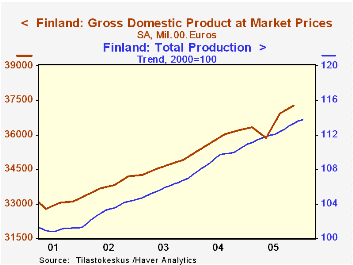
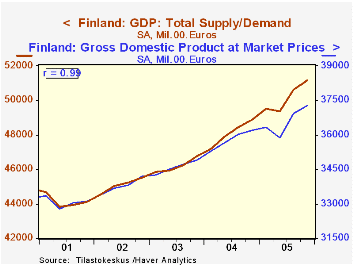
Indicators released today are pointing to an increase in the rate of growth of Finland's GDP in the first quarter from the 0.91% rate of the fourth quarter of 2005. The trend of the monthly total production series, which is a good indicator of Finland's Gross Domestic Product increased 0.18% in January from December and 2.61% from January, 2005. The first chart plots the monthly index of total production with the quarterly values of real GDP to show the leading characteristic of the monthly series. To show that the total production index is a good indicator of GDP, we have aggregated the monthly series quarterly and compared it with the quarterly GDP data as shown in the second chart. The correlation between the two series is .99.
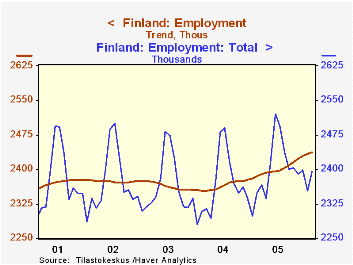
Another sign of increased activity in the first quarter is the rising trend of employment. In Finland, many series, the total production series noted above and some of the labor force data, are reported on seasonally adjusted basis. Instead of computing seasonally adjusted data, Finland computes trends of the unadjusted data. The third chart shows the trend and seasonally unadjusted data for employment. The trend continues to rise in January and February.
| Finland | Jan 06 | Dec 05 | Jan 05 | M/M % | Y/Y % | 2005 | 2004 | 2003 |
|---|---|---|---|---|---|---|---|---|
| TOTAL PRODUCTION (2000=100) | ||||||||
| Seasonally Unadjusted | 108.6 | 115.7 | 105.1 | -6.14 | 3.33 | 111.9 | 109.6 | 105.8 |
| Trend | 113.8 | 113.6 | 110.9 | 0.18 | 2.61 | 112.1 | 109.2 | 105.7 |
| Feb 06 | Jan 06 | Feb 05 | M/M % | Y/Y % | 2005 | 2004 | 2003 | |
| EMPLOYMENT (000) | ||||||||
| Seasonally Unadjusted | 2395 | 2353 | 2348 | 1.78 | 2.00 | 2401 | 2365 | 2365 |
| Trend | 2436 | 2433 | 2385 | 0.12 | 2.14 | 2401 | 2364 | 2366 |


