 Global| Apr 30 2007
Economic Sentiment Still Positive in the Euro Area as a Whole: But Turning Negative in Ireland and Spain
Summary
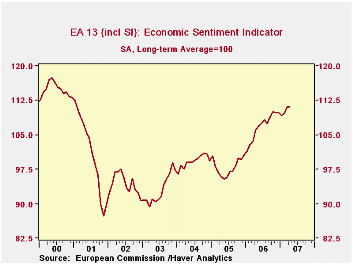
Economic sentiment in the Euro Area is still at its highest level since January, 2001, in spite of a slight decline--one basis point from March to 111.0 in April-- The economic sentiment indicator is so constructed that its long term [...]

Economic sentiment in the Euro Area is still at its highest level since January, 2001, in spite of a slight decline--one basis point from March to 111.0 in April-- The economic sentiment indicator is so constructed that its long term average is 100. Values above (below) 100 indicate a level of sentiment above (below) average.
The economic sentiment indicator declined sharply in 2001, reaching a low of 87.3 in November. There were short periods when the indicator rose above 100 in 2004 and 2005, but it has only been since December 2005 that there has been a sustained upward trend as can be seen in the first chart.
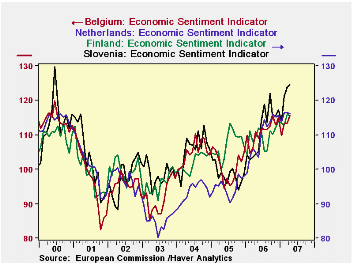
Sentiment has varied among the countries. The second chart shows the path of sentiment in Germany, France and Italy since 2000. Sentiment in Germany fell the most in the early period, but now appears to be making the strongest comeback of the "Big three".In Belgium, Finland, the Netherlands and Slovakia, economic sentiment is stronger than in the "Big three" as can be seen in the third chart. Two countries where the economic sentiment indicator has fallen below 100 are Spain and Ireland, shown in the fourth chart. These same countries had, until recently been among the brighter spots in the Euro Area. 

| EUROSTAT Business Climate (Long term Average=100) |
Apr 07 | Mar 07 | Apr 06 | M/M Dif | Y/Y Dif | 2006 | 2005 | 2004 |
|---|---|---|---|---|---|---|---|---|
| Euro Area | 111.0 | 111.1 | 106.0 | -0.1 | 5.0 | 106.9 | 97.9 | 99.2 |
| Germany | 111.4 | 110.0 | 105.7 | 1.4 | 5.7 | 105.9 | 95.1 | 95.8 |
| France | 109.4 | 109.3 | 106.2 | 0.1 | 3.2 | 106.9 | 103.3 | 106.0 |
| Italy | 110.4 | 111.5 | 108.4 | -1.1 | 2.0 | 108.6 | 97.9 | 98.4 |
| Belgium | 115.7 | 113.5 | 111.0 | 2.2 | 4.7 | 111.0 | 100.7 | 104.9 |
| Finland | 115.5 | 116.1 | 109.3 | -0.6 | 6.2 | 109.5 | 107.1 | 102.0 |
| Netherlands | 116.2 | 116.5 | 104.8 | -0.3 | 11.4 | 109.6 | 94.9 | 93.6 |
| Slovakia | 124.5 | 123.9 | 104.3 | 0.6 | 20.2 | 111.4 | 98.5 | 105.9 |
| Ireland | 99.2 | 101.2 | 101.0 | -2.1 | -1.8 | 103.8 | 96.9 | 96.4 |
| Spain | 98.6 | 100.8 | 98.1 | -2.2 | 0.5 | 98.5 | 100.1 | 100.6 |
More Economy in Brief
 Global| Feb 05 2026
Charts of the Week: Balanced Policy, Resilient Data and AI Narratives
by:Andrew Cates


