 Global| Feb 15 2008
EMU Trade Deficit Emerges
Summary
EMU import growth is slowing but export growth is slowing faster. As a result EMU has developed its first trade deficit in 16 months. Germany and Finland the two EMU countries with the lowest inflation rates in the last 10 years [...]
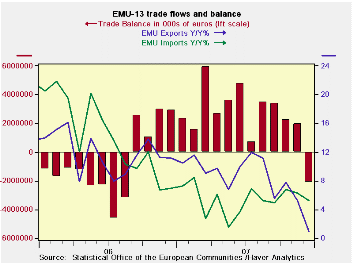
EMU import growth is slowing but export growth is slowing
faster. As a result EMU has developed its first trade deficit in 16
months. Germany and Finland the two EMU countries with the lowest
inflation rates in the last 10 years continue to post surpluses. As the
lowest inflation countries in this common currency area they are more
price competitive than other EMU nations.
On a seasonally adjusted basis, eight of the 13 countries
belonging to the euro area in December registered a trade deficit, led
by sizeable deficits in The Netherlands (-E8.0 billion) and Spain
(-E5.0 billion). Among the larger EMU countries, Italy (-E2.4 billion)
and France (-E0.6 billion) posted deficits. Red ink was also chalked up
on the trade account by were also posted by Belgium (-E1.8 billion) and
Greece (-E1.5 billion).
The EMU surplus with the US is now shrinking slightly and is
abut E8bln lower than it was a year ago. Exports to the US are down
Yr/Yr and imports are up. It is looking like the weak dollar/strong
euro are having an impact.
Like the US, EMU has a huge deficit with China that rose to
E101bln last year from E82.6bln in 2006, as imports from China’s
spurted by 18%. This is also a reminder that while corporations
continue to be very up beat on China growth, if the US and Europe
slowdown China’s exports and growth overall will slow as well. China
may have a slug of domestic infrastructure building in progress, but it
remains highly dependent on trade.
| Euro Area: 13-Trade trends for goods | ||||||
|---|---|---|---|---|---|---|
| m/m% | % Saar | |||||
| Dec-07 | Nov-07 | 3-Mo | 6-Mo | 12-Mo | 12-Mo Ago | |
| Balance* | €€ (2,105) | €€ 1,965 | €€ 703 | €€ 1,603 | €€ 2,550 | €€ (685) |
| Exports | ||||||
| All Exports | -2.5% | -0.7% | -8.3% | -3.2% | 1.0% | 11.2% |
| Food and Drinks | -1.8% | 0.6% | 0.3% | 7.1% | 5.1% | 12.0% |
| Raw Materials | -1.7% | -2.1% | -11.7% | -9.7% | 1.7% | 13.9% |
| Other | -2.6% | -0.8% | -8.8% | -3.6% | 0.7% | 11.0% |
| MFG | -4.2% | -0.4% | -17.1% | -7.1% | -2.3% | 11.3% |
| Imports | ||||||
| All Imports | 0.7% | -0.5% | 9.2% | 8.2% | 5.2% | 7.0% |
| Food and Drinks | -4.2% | -2.2% | -27.1% | 8.6% | 9.0% | 5.2% |
| Raw Materials | -0.3% | -2.1% | -4.9% | -4.9% | -1.8% | 23.6% |
| Other | 1.0% | -0.3% | 12.8% | 8.9% | 5.4% | 6.3% |
| MFG | -2.4% | -2.7% | -20.9% | -9.2% | -4.2% | 9.9% |
| *Eur mlns; mo or period average | ||||||

Robert Brusca
AuthorMore in Author Profile »Robert A. Brusca is Chief Economist of Fact and Opinion Economics, a consulting firm he founded in Manhattan. He has been an economist on Wall Street for over 25 years. He has visited central banking and large institutional clients in over 30 countries in his career as an economist. Mr. Brusca was a Divisional Research Chief at the Federal Reserve Bank of NY (Chief of the International Financial markets Division), a Fed Watcher at Irving Trust and Chief Economist at Nikko Securities International. He is widely quoted and appears in various media. Mr. Brusca holds an MA and Ph.D. in economics from Michigan State University and a BA in Economics from the University of Michigan. His research pursues his strong interests in non aligned policy economics as well as international economics. FAO Economics’ research targets investors to assist them in making better investment decisions in stocks, bonds and in a variety of international assets. The company does not manage money and has no conflicts in giving economic advice.
More Economy in Brief


