 Global| Apr 18 2006
English and Welsh Housing Market Shows Improvement
Summary
The housing market in England and Wales is showing improvement. The RICS (Royal Institute of Chartered Surveyors) survey of the housing market shows that although the pace has slackened, house prices continue to rise and expectations [...]

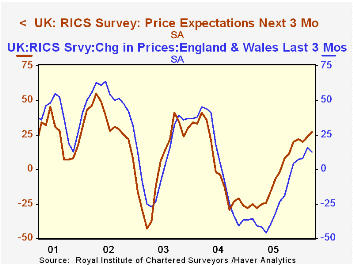
The housing market in England and Wales is showing improvement. The RICS (Royal Institute of Chartered Surveyors) survey of the housing market shows that although the pace has slackened, house prices continue to rise and expectations of price increases are becoming stronger as can be seen in the first chart.
The RICS survey, which was released today is an excellent source of information on many aspects of the housing market in England and Wales. It is found in Haver's UK data base and in INTSRVYS-G10+ Country Surveys.
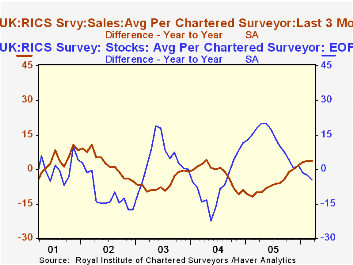
There are data on the average units sold and the average stock of units held per chartered surveyor and the relation of sales to stocks. The average units sold has improved and in March was 16.4% above the units sold in March 2005. Over the same period the stock of units held has declined by 5.9%. The second chart shows the year over year percentage change in the average units sold and the average stock of units per chartered surveyor. Although we do not have the absolute levels of sales and stocks of housing units, the rising trend of sales and declining trend of stocks suggests an improving supply and demand situation.
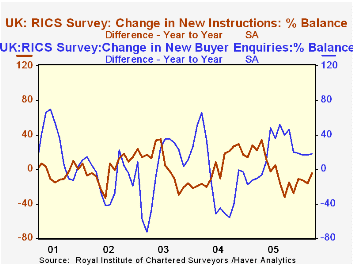
The same sort of relative improvement in the housing market can be seen in the year to year difference in the percent balances of new buyer enquiries and the new offerings by sellers. (See the third chart.) The year to year difference in the percent balance of new buyer enquiries has been positive since early 2005, while the year to year difference in the percent balance on new offering by sellers has been negative.
| England and Wales: RICS Survey |
Mar 06 | Feb 06 | Mar 05 | M/M % | Y/Y % | 2004 | 2003 | 2002 |
|---|---|---|---|---|---|---|---|---|
| Units | ||||||||
| Average Stock per Surveyor | 72.2 | 71.7 | 76.7 | 0.70 | -5.87 | 75.8 | 64.1 | 70.1 |
| Average Sales per Surveyor | 25.5 | 24.9 | 21.9 | 2.41 | 16.44 | 22.5 | 28.5 | 30.7 |
| Percent Balance | Mar 06 | Feb 06 | Mar 05 | M/M dif | Y/Y dif | 2004 | 2003 | 2002 |
| Actual House Prices | 11 | 10 | -7 | 1 | 18 | 6 | -12 | -5 |
| Expected House Prices | 27 | 24 | -28 | 3 | 55 | -8 | 4 | 3 |
| Expected Sales next 3 months | 28 | 24 | 24 | 4 | 4 | 28 | 19 | 18 |
| Newly Agreed Sales | 17 | 12 | -7 | 5 | 24 | 2 | -9 | -2 |
| New Buyer Enquiries | 11 | 10 | -7 | 1 | 18 | 6 | -12 | -5 |
| New Stock | 13 | 8 | 18 | 5 | -5 | 11 | 10 | 8 |
More Economy in Brief
 Global| Feb 05 2026
Charts of the Week: Balanced Policy, Resilient Data and AI Narratives
by:Andrew Cates


