Global| Oct 02 2007
Euro Area PPI Behaves in August
Summary
The Euro Area's year-over-year PPI excluding construction continues to head lower, while the six-month measure has seen some steady pressure and recent quasi-plateauing. But the three-month PPI is heading strongly lower. On balance, [...]
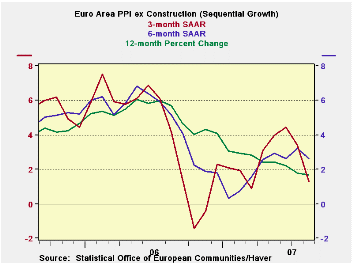
The Euro Area's year-over-year PPI excluding construction continues to head lower, while the six-month measure has seen some steady pressure and recent quasi-plateauing. But the three-month PPI is heading strongly lower. On balance, the Euro area PPI seems to be well-behaved.
The trends are well-behaved across components as well. Only consumer goods prices at the producer level are showing any acceleration in the recent three-months among major categories. Capital good prices are decelerating as are intermediate and energy goods. Manufacturing as a whole shows prices decelerating and the PPI ex-energy is also decelerating. The EMU PPI is well contained.
At the country level, Germany and Italy show the same sort of compliant patterns in their respective PPIs. The EU’s UK demonstrates some flare up in the overall PPI but still shows a PPI ex energy with decelerating trends. These are encouraging trends but this is not the ECB’s prime inflation measure. That one, the HICP, has been showing some pressure lately. But the lack of pressure at the PPI level is still good news – at least through August.
| Euro Area and UK PPI Trends | ||||||
|---|---|---|---|---|---|---|
| M/M | SAAR | |||||
| Euro Area 13 | Aug-07 | Jul-07 | 3-Mo | 6-MO | Yr/Yr | Y/Y Yr Ago |
| Total ex Construction | 0.1% | 0.3% | 1.7% | 3.2% | 1.7% | 5.7% |
| Excl Energy | 0.2% | 0.2% | 2.5% | 3.2% | 2.9% | 3.6% |
| Capital Goods | 0.0% | 0.1% | 0.6% | 0.9% | 1.6% | 1.6% |
| Consumer Goods | 0.5% | 0.4% | 4.4% | 3.3% | 2.3% | 1.9% |
| Intermediate & Capital Goods | 0.1% | 0.1% | 1.3% | 3.0% | 3.3% | 4.6% |
| Energy | -0.7% | 0.4% | -1.2% | 3.3% | -2.2% | 12.6% |
| MFG | 0.1% | 0.3% | 2.4% | 4.8% | 2.2% | 4.0% |
| Germany | 0.1% | -0.1% | 0.7% | 1.7% | 1.0% | 5.9% |
| PPI ex Energy | 0.3% | 0.1% | 2.2% | 2.8% | 2.6% | 3.0% |
| Italy | 0.1% | 0.3% | 2.0% | 3.7% | 1.9% | 6.6% |
| PPI ex Energy | 0.3% | 0.2% | 2.1% | 3.2% | 3.1% | 4.1% |
| UK | -0.6% | 0.7% | 2.6% | -2.3% | -0.1% | 8.4% |
| PPI ex Energy | 0.2% | 0.4% | 2.5% | 2.7% | 3.0% | 3.0% |
| Euro area 13 Harmonized PPI excluding Construction | ||||||
| The EA 13 countries are Austria, Belgium, Finland, France, Germany, Greece, Ireland, Italy, Luxembourg, the Netherlands, Portugal, Slovenia and Spain. | ||||||

Robert Brusca
AuthorMore in Author Profile »Robert A. Brusca is Chief Economist of Fact and Opinion Economics, a consulting firm he founded in Manhattan. He has been an economist on Wall Street for over 25 years. He has visited central banking and large institutional clients in over 30 countries in his career as an economist. Mr. Brusca was a Divisional Research Chief at the Federal Reserve Bank of NY (Chief of the International Financial markets Division), a Fed Watcher at Irving Trust and Chief Economist at Nikko Securities International. He is widely quoted and appears in various media. Mr. Brusca holds an MA and Ph.D. in economics from Michigan State University and a BA in Economics from the University of Michigan. His research pursues his strong interests in non aligned policy economics as well as international economics. FAO Economics’ research targets investors to assist them in making better investment decisions in stocks, bonds and in a variety of international assets. The company does not manage money and has no conflicts in giving economic advice.
More Economy in Brief
 Global| Feb 05 2026
Charts of the Week: Balanced Policy, Resilient Data and AI Narratives
by:Andrew Cates