 Global| Sep 06 2011
Euro-Area's PMI's Pointing to Lower Economic Activity
Summary
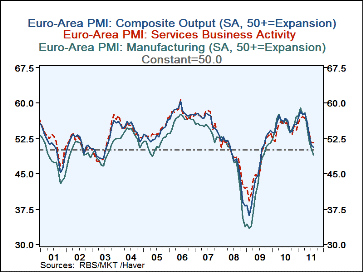
Purchasing Managers in the Service Industry in the Euro Area continue to downgrade their prospects. The Final Estimate for the August diffusion index representing their views was 51.4840, compared with 51.5776 for July. It was also [...]
 Purchasing Managers in the Service Industry in the Euro Area continue
to downgrade their prospects. The Final Estimate for the August
diffusion index representing their views was 51.4840, compared with
51.5776 for July. It was also below the Flash Estimate of 51,5362 that was
released on August 23rd. Although the Service Index was still above
50, the dividing mark between expansion and contraction, the index for
manufacturing that was released on September 1st, fell to 48.9938 from
51.1486 in July, suggesting contraction in the manufacturing
industry. The composite index, combining the results of the service
and manufacturing industries was 50.6690 in August, down from 51.1486 in
July is barely in the expansion phase. The PMI's for the service and
manufacturing industries and the composite are shown in the first
chart, together with the 50 mark line.
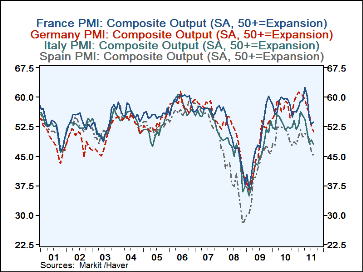
PMI's are available for France, Germany, Italy, Ireland and Spain. The composite indexes for France and Ireland increased in August while the others declined. The composite indexes for France, Germany, Italy and Spain are shown in the second chart. The indexes for Spain and Italy are now definitely in the contraction area.
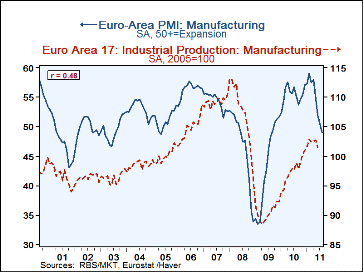
PMI's are often used in appraising the economic outlook. The recent decelerations and, in some cases, declines in country PMI's suggest slower growth in the Euro-Area's economy in the third quarter. Some indication of the reliability of the PMI's in predicting future economic trends can be seen in the third chart that shows the correlation between the Manufacturing PMI of the Euro-Area and its Industrial Production Index. The correlation, is .48 and the R Squared, .21, which means that changes in the manufacturing PMI account for about 21% of the variation in the Euro-Area Industrial Production. While the correlation is not so high as one might wish, it is not insignificant
| Euro-Area PMI's | Aug 11 | July 11 |
|---|---|---|
| Service | ||
| Flash Estimate | 51.5382 | 51.4076 |
| Final Estimate | 51.4840 | 51.5776 |
| Manufacturing | 48.9938 | 50.3629 |
| Composite | 50.6690 | 51.1486 |
| France | 53.7139 | 53.1824 |
| Germany | 51.2979 | 52.5185 |
| Italy | 47.9889 | 49.0793 |
| Spain | 45.0320 | 46.1209 |
| Ireland | 51.5384 | 51.0611 |
More Economy in Brief
 Global| Feb 05 2026
Charts of the Week: Balanced Policy, Resilient Data and AI Narratives
by:Andrew Cates


