 Global| Oct 13 2014
Euro Is Still Too Strong, According to PPP
Summary
The best way to evaluate the relative strength or weakness of a currency is to assess it using purchasing power parity (PPP). According to this method, we take the euro area and its measure of its price level and compare it to another [...]
 The best way to evaluate the relative strength or weakness of a currency is to assess it using purchasing power parity (PPP). According to this method, we take the euro area and its measure of its price level and compare it to another area and its price level after adjusting for exchange rate changes. The measure of PPP tells us to what extent the exchange rate has moved to offset the differences in national inflation rates. In the first table, we have both broad and narrow views of PPP, and not surprisingly, they give us different results. The broad measure assesses PPP vs. a large group of countries while the narrow one assesses it vs. a smaller group. PPP is an empirical measure so its assessment will change as you use different groups of nations or apply it over different time periods.
When we use these broad measures for PPP (or even the narrow one for that matter since it also uses an amalgam of countries), we are looking at the euro area against a weighted average of other countries' exchange rates and inflation rates/price levels.
If we look at the current exchange rate relative to 1990, when the euro area was formed, we see the broad real euro has fallen by 1.4% while the narrow real euro has risen by 6.2%.
At the bottom of the first table, I compare the current exchange rate levels for the real broad and real narrow euro to their full period averages.
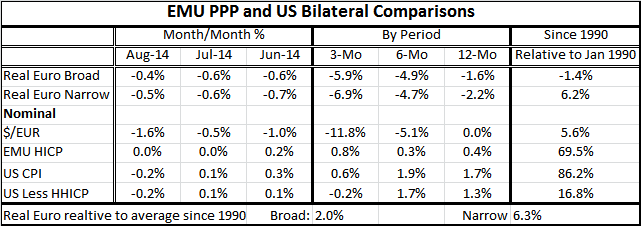
According to an application of the PPP theory, if exchange rates are gotten right by markets, the average of a large sample of PPP data should be a good estimator of the proper PPP value for the exchange rate. What we see from these calculations is that the broad euro is currently 2% too strong while the narrow euro is 6.3% too strong, according to this application of PPP theory.
Looking separately at the euro versus the dollar, we see that since 1990 the euro has risen by 5.6% while the EMU price level has risen by 69% versus the U.S. price level which has risen by 86%. On this horizon, the U.S. price level has risen by some nearly 17% more than the euro price level swamping the rise of the nominal exchange rate and leaving the euro in a position of having a net improvement in competitiveness over this period. However, while this calculation demonstrates a change in competitiveness, it does not demonstrate a level of competitiveness. For that, we have to look at the value relative to their respective means.
Indeed, when the euro launched Europe was awash in optimism It launched some 25% stronger than dollar parity (one euro to one dollar) and rose for about one year before it staged a turnaround of sorts. By the time, the U.S. was slipping into recession in 2000; the euro had weakened and had broken through parity but that was not about to last.
The chart at the top shows a longer view of the PPP gauge for Europe. Employing the `synthetic euro', a calculation that uses the countries and the weights of the euro and extends the PPP calculation prior to the formation of the euro area itself. This technique allows a broader view of PPP, while still employing all the necessary ingredients. It also shows that the euro currently is overvalued. That means it finds that the value of the euro is much stronger relative to its price level, compared to other currencies after exchange rate adjustment.
However, when we make these statements and calculations for the euro area, we have to remember that the euro area itself is an amalgam of member nations. What is true for the euro area may not be true of each member nation. The table below gives us inflation results for a number of EMU members available through August. Here we are reminded that there has been different inflation performance across the various EMU member nations. When we compare the level of competitiveness for the European Monetary Union with other countries outside the union, we must remember that individual countries within the union are going to have a different PPP position than the EMU as a whole, because inflation has been different from the EMU average for individual EMU nations compared to the average for the EMU as a whole.
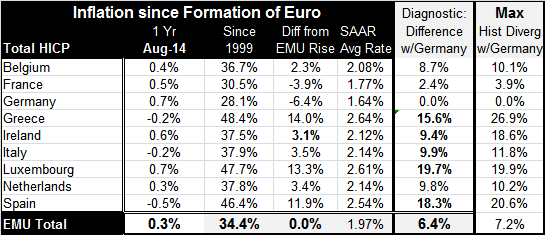
The table reminds us that since the EMU was formed, every country in this table has had higher inflation than Germany. Only two countries, France and Germany, have had lower inflation than the EMU average. That means when we use PPP to evaluate competitiveness in the euro area, we have to augment German competitiveness by about 6% and French competitiveness by about 4%. We have to subtract to arrive at competitiveness for other member countries. For example, we have to subtract about 14% for Greece and about 12% for Spain.
Because EMU members have had widely different inflation experiences, their position relative to EMU parity is going to differ by the gap between each country's accumulated national inflation rise and the accumulated rise for the EMU as a whole. In all cases, except Germany and France, it means that individual national competitiveness is going to be worse than it is for the EMU as a whole.
Were the EMU exchange rate to get perfectly into EMU PPP, Germany would be 6% more competitive vs. parity while Spain would still be 12% on the uncompetitive side.
This puts a slightly different spin on how we interpret EMU inflation and its price level. If it's true that since 1990 broad competitiveness in the euro area has eroded, and the euro is too high by 6% then for Greece. The price level is too high by 20% and for Spain by nearly 18% while for Germany, the exchange rate would be just about right.
You can apply these PPP calculations on a bilateral basis too, to see where the union stands versus any particular trade partner.
But we find in assessing the EMU exchange rate is that its current movement lower accords with our view of the PPP requirement for the currency. Right now, the euro is being pressured lower substantially because it continues to run an aggressively expansionary policy. While one of its important trading partners, the United States, is starting to anticipate a less accommodative policy. Typically, when countries pursue an aggressive easing, that push causes the currency to get weaker, and when a country is pursuing a tighter policy, it causes the currency to get stronger. However, we can make a statement about currencies only when looking at both sides of a currency pair (or weighted average comparison) since the exchange rate pressure is about the policies and economic data of one currency versus another. In the case of the U.S. versus Europe, we see that there's a very clear implication for exchange rate movement given the positions of the respective central banks.
While there's a great deal of argument about how some of these unconventional monetary policies work, especially about quantitative easing, one clear channel seems to be through the exchange rate. To the extent that the central bank communicates to the market that it has set its sights on an aggressive easing policy, it can unhinge the exchange rate and a lower exchange rate to stimulate an economy by making its exports more competitive, causing them expand faster, and by making imports less competitive, so they will penetrate the domestic market with reduced efficacy.
We have seen this exchange rate effect kick work for the U.S. when it initially adopted its quantitative easing policy. We saw it operate for Japan when it adopted its more aggressive quantitative easing policy. And we see it operating in the EMU as its central bank continues to search for special ways to implement accommodation.
This is not to say that there are no other channels for unconventional monetary policy to affect markets. In the case of the Federal Reserve, it likes to refer to quantitative easing as a program of large scale asset purchases (LSAP) which focuses on the role of these purchases in taking high quality assets out of the market and forcing market participants to buy riskier securities to stimulate the economy.
So far one of the main ways this program has worked in the U.S. is by causing investors to stop buying bonds or to reach for yield and purchase riskier bonds or to eschew the bond market altogether and pile into stocks. Until recently, that strategy seems to be working, but with the recent slippage in the Dow Jones Industrial Average, that index has given up all of its gains to date for the year, leaving investors only with the stocks' dividend yield.
We can see that there are marked impacts on national economies and especially on the exchange rate which work through the chosen policy of central banks. This is just one more reason why central bankers should be very careful about increasing the dose of monetary policy to compensate for a restricted fiscal policy. In just the same way as two wrongs don't make a right, putting two markets out of equilibrium doesn't necessarily put the economy any closer to being in equilibrium. The boost to growth could be a precursor to a worsening of policy options down the road.

Robert Brusca
AuthorMore in Author Profile »Robert A. Brusca is Chief Economist of Fact and Opinion Economics, a consulting firm he founded in Manhattan. He has been an economist on Wall Street for over 25 years. He has visited central banking and large institutional clients in over 30 countries in his career as an economist. Mr. Brusca was a Divisional Research Chief at the Federal Reserve Bank of NY (Chief of the International Financial markets Division), a Fed Watcher at Irving Trust and Chief Economist at Nikko Securities International. He is widely quoted and appears in various media. Mr. Brusca holds an MA and Ph.D. in economics from Michigan State University and a BA in Economics from the University of Michigan. His research pursues his strong interests in non aligned policy economics as well as international economics. FAO Economics’ research targets investors to assist them in making better investment decisions in stocks, bonds and in a variety of international assets. The company does not manage money and has no conflicts in giving economic advice.
More Economy in Brief

 Global| Feb 05 2026
Charts of the Week: Balanced Policy, Resilient Data and AI Narratives
by:Andrew Cates

