 Global| Jan 31 2005
Euro Zone Confidence Shows Little Signs of Improvement and EuroCOIN Points to Slow Growth in 4th Quarter GDP
Summary
Pessimism continues to outweigh optimism among business and consumers in the Euro Zone.The excess of consumers who were pessimistic over those who were optimistic remained at 13% in January, unchanged from December. In the business [...]

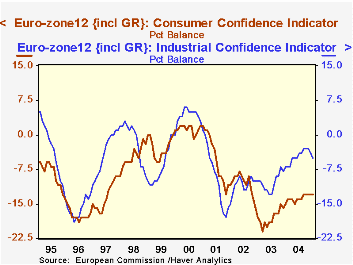
Pessimism continues to outweigh optimism among business and consumers in the Euro Zone.The excess of consumers who were pessimistic over those who were optimistic remained at 13% in January, unchanged from December. In the business sector, the excess of pessimists in the industrial increased from 4% to 5% from December to January and in the construction industry from 13% to 14%. In the retail sector, the excess of pessimists declined from 7% to 6%. The only area where optimists outweigh pessimists is in the service sector where the excess of optimists over pessimists increased from 10% in December to 13% in January. The first chart compares of consumer confidence with industrial business confidence.
Sluggish growth in the EuroZone economy has no doubt played a large role in the malaise evident among consumers and business. A relatively new indicator of EuroZone growth, EuroCOIN, is not encouraging.EuroCOIN is a coincident indicator of the euro area business cycle. It was launched in 2002 by the Centre for Economic Policy Research, a London based coordinator of research conducted by academics from Europe and the U. S. and financed by a variety of central banks, commercial banks and corporations.EuroCOIN is a monthly estimate of the cyclical components of GDP. It tends to signal the underlying direction of the Euro Zone economy. The December value of the indicator was .427, a decline of .032 from November, suggesting little growth for the 4th quarter Euro GDP. The second chart shows the EuroCOIN indicator and the quarterly growth of real GDP.
| Percent Balance | Jan 05 | Dec 04 | Jan 04 | M/M Dif | Y/Y Dif | 2004 | 2003 | 2002 |
|---|---|---|---|---|---|---|---|---|
| Consumer confidence | -13 | -13 | -15 | 0 | 2 | -14 | -18 | -11 |
| Business confidence | ||||||||
| Industrial | -5 | -4 | -7 | -1 | 2 | -5 | -10 | -11 |
| Construction | -14 | -13 | -18 | -1 | 4 | -16 | -20 | -19 |
| Retail | -6 | -7 | -8 | 1 | 2 | -8 | -12 | -17 |
| Service | 13 | 10 | 11 | 3 | 2 | 12 | 2 | 1 |
| Dec 04 | Nov 04 | Dec 04 | M/M Dif | Y/Y Dif | 2004 | 2003 | 2002 | |
| EuroCOIN | 0.427 | 0.459 | 0.648 | -0.032 | -0.221 | 0.511 | 0.527 | 0.463 |
More Economy in Brief
 Global| Feb 05 2026
Charts of the Week: Balanced Policy, Resilient Data and AI Narratives
by:Andrew Cates


