 Global| May 22 2006
Euro Zone Has Small Surplus on Trade in Goods in March: EU 25 a Smaller Deficit
Summary
The Euro Zone as a whole has typically had a surplus on its trade in goods with non Euro Zone countries. However, in August, October and December of 2005 and in January and February of this year substantial deficits were recorded.The [...]

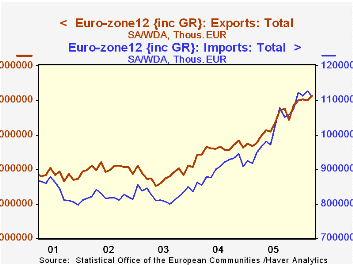
The Euro Zone as a whole has typically had a surplus on its trade in goods with non Euro Zone countries. However, in August, October and December of 2005 and in January and February of this year substantial deficits were recorded.The rising price of oil led to increased imports and an increasing euro led to some dampening of export demand. In March, however, a small surplus was recorded as seasonally adjusted imports declined by 1.5% and exports rose 1.2%. The first chart shows monthly exports and imports of goods for the Euro Zone on a seasonally adjusted basis.
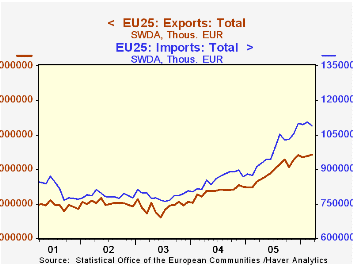
The 25 member European Union as a group has typically runs a deficit of its trade in goods with non EU members as can be seen in the second chart, which shows the gap between imports and exports. The deficit in March was 12.2 billion euros, down from 14.8 billion euros in February but 5.4 billion euros over March 2005. It is not possible to derive the trade balance and exports and imports of the non Euro Zone European Union Members from these series. The Euro Zone data refer to trade with all non Euro Zone countries, including those in the European Union, while the EU25 data refer to trade with non EU countries. However, seasonally adjusted data for the Euro Zone trade balance, imports and exports with major countries and selected groups of countries are available as well as seasonally unadjusted data for the trade balance, imports and exports for each of the EU25 countries.
| Billions of Euros | Mar 06 | Feb 06 | Mar 05 | M/M % | Y/Y % | 2005 | 2004 | 2003 |
|---|---|---|---|---|---|---|---|---|
| Euro Zone Balance on Trade | 0.4 | -2.8 | 2.8 | 3.2* | -2.4* | 23.3 | 72.3 | 69.4 |
| Exports | 111.4 | 110.0 | 97.7 | 1.22 | 13.92 | 1236.0 | 1147.4 | 1060.0 |
| Imports | 111.0 | 112.8 | 94.9 | -1.51 | 17.02 | 1212.7 | 1075.0 | 990.6 |
| European Union Balance on Trade | -12.2 | -14.8 | -8.8 | -2.6* | -3.4* | -106.1 | -620 | -58.6 |
| Exports | 96.5 | 95.8 | 84.5 | 0.73 | 14.26 | 1068.1 | 964.5 | 883.9 |
| Imports | 108.6 | 110.7 | 91.3 | -1.72 | 19.12 | 1174.3 | 1026.6 | 942.5 |
More Economy in Brief
 Global| Feb 05 2026
Charts of the Week: Balanced Policy, Resilient Data and AI Narratives
by:Andrew Cates


