 Global| Jun 19 2006
Euro Zone Trade Deficit Increases in April: Rising Cost of Petroleum Imports the Culprit
Summary
The Euro Zone reported a deficit for April of 870 million euros in its trade in goods with the rest of the world. This was more than double the March figure of 350 million euros, and was in sharp contrast to the surplus of 3,167 [...]

The Euro Zone reported a deficit for April of 870 million euros in its trade in goods with the rest of the world. This was more than double the March figure of 350 million euros, and was in sharp contrast to the surplus of 3,167 million euros of April, 2005.
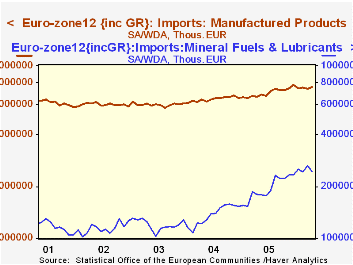
The deterioration in the Euro Zone's trade balance over the past year is largely the result of the increasing cost of fuel imports. The import category--mineral fuels and lubricants--is compared with the import category of manufactured products in the first chart. The data are plotted on a log scale so that the rates of change in the two series can be compared. It is apparent that imports of petroleum products have been rising at a much faster rate than those of manufactured products.
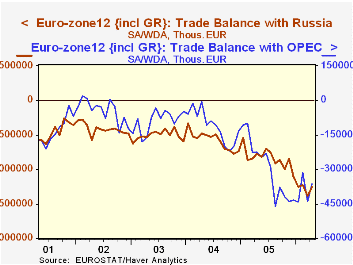
The impact of rising oil prices is also reflected in the Euro Zone's trade balances with Russia and with OPEC, as can be seen in the second chart. The deterioration in trade with Russia from April of last year to April of this year was 1,408.2 million euros and that in trade with OPEC was 1,379.5 million euros. Together these two deficits accounted for about two thirds of the total deficit of 4,036.6 million euros.
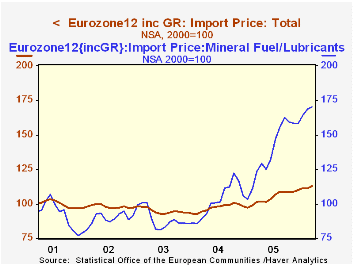
The final chart compares the prices of mineral fuels, lubricants and related products with the prices of all imports. Once again the data have been presented on a log scale to facilitate the comparison of rates of change. Over the past year, the prices of mineral fuels, lubricants and related product have risen 35.8% or more than three times as fast as the prices of all imports.
| Euro Zone Trade in Goods (SA & WDA--Million Euros) |
April 06 | April 05 | Y/Y Difference |
|---|---|---|---|
| Exports | 113,735.5 | 99,919.8 | 17,872.4 |
| Imports | 114,625.4 | 96,753.0 | 13,835.7 |
| Balance | -869.9 | 3,166.8 | -4,036.6 |
| Balance of Mineral Fuels and Lubricants | -20,037.5 | -15,215.7 | -4,821.8 |
| Balance on Manufactured Products | 20,843.1 | 19,328.9 | 1,514.2 |
| Balance with Russia | -3,747.6 | -2,339.4 | -1,408.2 |
| Import Price of Mineral Fuels, Lubricants and related Products (2000=100) |
125.10 | 101.2 | 11.6* |
| Import Price of Total Imports | 169.90 | 125.10 | 35.8* |


