 Global| Mar 21 2005
European Finance Ministers Agree to Modify Terms of the Stability and Growth Pact
Summary
The European Union Finance Ministers agreed to loosen the terms of the Growth and Stability Pact that was designed to ensure fiscal discipline among the member countries. The pact has virtually been suspended since November, 2003 when [...]

The European Union Finance Ministers agreed to loosen the terms of the Growth and Stability Pact that was designed to ensure fiscal discipline among the member countries. The pact has virtually been suspended since November, 2003 when France and Germany failed to be censured for their failure to adhere to the letter of the law. With Italy now added to France and Germany having deficits above 3% of Gross Domestic Product (GDP), the need for a review of the criteria of the Growth and Stability Pact became more pressing.
Under the original terms of the Pact, countries having budget deficits in excess of 3% of GDP in two successive years were subject to sanctions and fines unless they experienced a 2% decline in growth. Now, while the 3% limit is maintained, countries may subtract certain expenditure from the calculation of the deficit. Germany, for example, may deduct the costs of reunification and France has been allowed to deduct certain military and research expenditures. Moreover, countries with excessive deficits may take two years to get back under the limit, a period that is renewable for two more years. To mitigate problems for some of the potential new members, the finance ministers agreed to give a five year reprieve to those countries reforming their pension schemes. It is expected that these changes will be ratified at the Brussels summit on March 22-23. While these changes will benefit the big spenders, they are not likely to do much for Greece. Greece will need fundamental restructuring if it is to remain in the Euro zone.
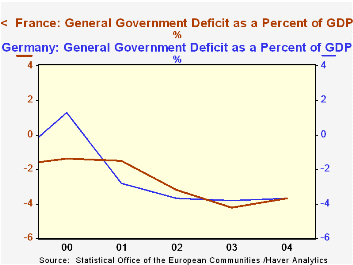
Data on the deficits and surpluses as a percentage of GDP of the European Union countries are available on an annual basis in Haver's Eurostat data base. Data for the Euro zone countries are shown in the table below and the data for France and Germany are shown in the attached chart.
| Deficit (-)/Surplus (+) %of GDP | 2004 | 2003 | 2002 | 2001 | 2000 |
|---|---|---|---|---|---|
| Austria | -1.3 | -1.1 | -0.2 | 0.3 | 1.5 |
| Belgium | 0.1 | 0.4 | 0.1 | 0.6 | 0.2 |
| Finland | 2.1 | 2.5 | 4.3 | 5.2 | 7.1 |
| France | -3.7 | -4.3 | -3.2 | -1.3 | -1.4 |
| Germany | -3.7 | -3.1 | -3.7 | -2.8 | 1.3 |
| Greece | -6.1 | -5.2 | -4.1 | -3.6 | -4.1 |
| Ireland | 1.3 | 0.2 | -1.4 | 0.9 | 4.4 |
| Italy | -3.0 | -2.9 | -2.6 | -3.0 | -0.6 |
| Luxembourg | -1.1 | 0.5 | 2.3 | 6.2 | 6.0 |
| Netherlands | -2.5 | -3.2 | -1.9 | -0.1 | 2.2 |
| Portugal | n.a. | -2.8 | -2.7 | -4.4 | -2.8 |
| Spain | -0.3 | 0.2 | -1.3 | -1.5 | 0.9 |


