 Global| Oct 03 2011
European Financial Woes And Manufacturing Production
Summary
The financial turmoil in the Euro Area is beginning to take its toll on manufacturing production. Signs of a worldwide slowdown in manufacturing are becoming apparent in purchasing managers' appraisals of the outlook. The September [...]
The financial turmoil in the Euro Area is beginning to take its toll on manufacturing production. Signs of a worldwide slowdown in manufacturing are becoming apparent in purchasing managers' appraisals of the outlook.
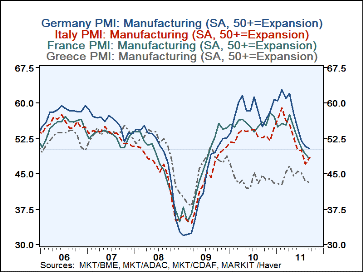
The September Purchasing Managers Index for the Euro Area was 48.51, slightly above the advance estimate of 48.37, but below August's 48.99 and below the 50 mark that represents the dividing point between contraction and expansion. Contraction rather than expansion is the norm in all the countries of the Euro Area for which estimates are made, except for Germany and that is only minimally above the 50 mark at 50.34. The first chart plots the PMIs for manufacturing for France, Germany, Italy and Greece.
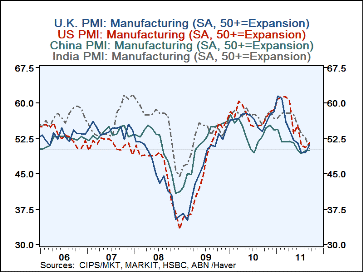
Outside the Euro Area, the effect of the financial trouble in Europe on manufacturing production has been more limited, but the impact is there and is growing. The PMIs for United States and the United Kingdom rose in September after having declined for a number of months. China's PMI also rose but by a mere 0.04 points in September and it remains just below the 50 mark. The PMI in Japan, rose rapidly as recovery from the March earthquake and tsunami got underway, but has recently fallen and was below the 50 mark in September. India's PMI fell more than 2 percentage points in September and is now at 50.41, just above the contraction zone. The second chart plots the PMIs for China, India, the United States and the United Kingdom.
Note: Data on PMIs can be found in two data bases: Markit Economics Purchasing Managers Survey INTSRVYS and Purchasing Managers Survey PMI. Advanced estimates of the PMIs are available for a few countries--France, Germany and China--and for the Euro Area in the two data bases. These are usually available a week or so before the final estimates The PMIs are diffusion indexes based on the balance of opinion of those looking for improvement and those looking for deterioration and range from 0 to 100. A number greater than 50 represents expansion while a number less than 50 represents contraction.
| Purchasing Managers' Indexes | Sep 11 | Aug 11 |
|---|---|---|
| Euro Area | 48.51 | 48.99 |
| Austria | 48.71 | 50.10 |
| Germany | 50.34 | 50.87 |
| France | 48.15 | 49.11 |
| Italy | 48.33 | 46.97 |
| Ireland | 47.26 | 49.71 |
| Spain | 43.74 | 45.32 |
| Greece | 43.23 | 43.32 |
| China | 49.95 | 49.91 |
| India | 50.41 | 52.59 |
| United States | 51.60 | 50.60 |
| United Kingdom | 51.08 | 49.39 |
| Japan | 49.34 | 51.93 |
More Economy in Brief
 Global| Feb 05 2026
Charts of the Week: Balanced Policy, Resilient Data and AI Narratives
by:Andrew Cates


