 Global| Aug 14 2007
European GDP Growth Slows More Than Expected
Summary
According to Flash Estimates, growth in the Euro Area slowed more than expected in the second quarter to a rate of 0.3% from 0.7% in the first quarter.Consensus estimates suggested a rate of 0.5%. While details of the composition of [...]
According to Flash Estimates, growth in the Euro Area slowed more than expected in the second quarter to a rate of 0.3% from 0.7% in the first quarter.Consensus estimates suggested a rate of 0.5%. While details of the composition of GDP will not be available until September 3rd, other data suggest that the consumer held up well, but that growth in the manufacturing sector decelerated, as a result, in part, of the rise in the euro. The volume of retail sales increased 0.16% in the second quarter after a 0.05% decline in the first quarter. Manufacturing sales, however, rose only 1.29% in the second quarter after a 2.12% increase in the first quarter.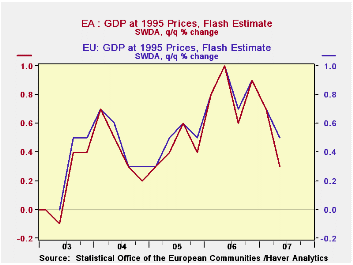
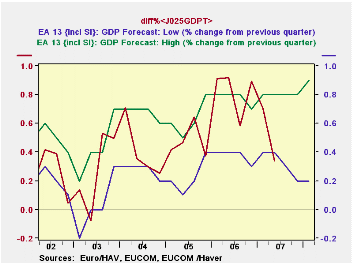
The European Commission projects a range of economic growth for three quarters ahead within which actual growth is expected to fall. As can be seen in the first chart which shows the actual growth and the range of estimates, the actual for the second quarter fell below the lower limit for the first time since the second quarter of 2003. Moreover, the range is widening, suggesting that the Commission is more uncertain about the future.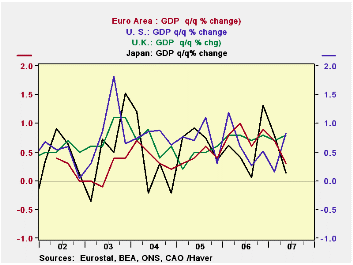
Among the Euro Area countries, German GDP fell from 0.5% in the first quarter to 0.3% in the second. For France, comparable figures were also 0.5% and 0.3%. Greece experienced a sharp decline from 3.2% in the first quarter to -0.8% in the second. For the 27 members of the European Union growth in the second quarter was 0.5%. Among the members outside the Euro Area that showed higher rates of growth were the UK at 0.8%, Sweden at 1.0% and Slovakia at 2.4%. Percent changes in GDP for the Euro Area and the European Union are shown in the second chart.
Growth in the Euro Area in the second quarter is now below that of the UK and the US, but is above that of Japan, as can be seen in the third chart.
| ESTIMATES OF REAL GDP CHANGE | Q1 08 | Q4 07 | Q3 07 | Q2 07 | Q1 07 |
|---|---|---|---|---|---|
| EURO AREA: Actual Q/Q % | -- | -- | -- | 0.3 | 0.7 |
| Forecast Range: High | 0.9 | 0.8 | 0.8 | 0.8 | 0.8 |
| Forecast Range: Low | 0.2 | 0.2 | 0.3 | 0.4 | 0.4 |
| EUROPEAN UNION: Actual Q/Q% | -- | -- | -- | 0.5 | 0.7 |
| UNITED KINGDOM: Actual Q/Q% | -- | -- | -- | 0.8 | 0.7 |
| JAPAN: Actual Q/Q% | -- | -- | -- | 0.1 | 0.8 |
| UNITED STATES | -- | -- | -- | 0.8 | 0.2 |
| SWEDEN | -- | --- | -- | 0.7 | 1.0 |
| GREECE | -- | -- | -- | -0.8 | 3.2 |
| SLOVAKIA | -- | -- | -- | 2.4 | 2.4 |
by Robert Brusca August 14, 2007
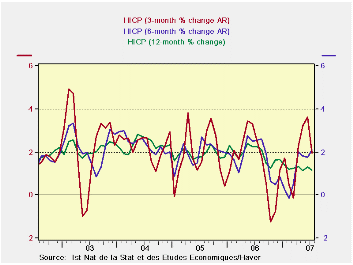
3-month inflation shifts much lower.
French inflation trends show France’s contribution to the Euro area’s inflation trends are middle of the road. France is still not in great shape but it is not one of the problem countries on the inflation side. And France has seen its GDP slow unexpectedly in the second quarter. The French stock market remains one of the very weakest in Europe. We are for the first time getting some consistent signs of slowing from Europe. It’s too soon to say if they will last or not.
The trouble for the ECB is going to be sorting out the disparate trends. It will have to deal with its previous hint that it was set to hike rates and compare it to actual current needs. Financial markets events work to put the ECB on hold. And then there is the GDP picture which was not as strong in Q2 as had been expected across the Euro area. The moderation of inflation trends feeds a third development into this mix that also comes out on the side of pushing the ECB to stay its hand.
This by the way is not a isolated position for the ECB. Japan’s central bank is in a similar fix for all the same reasons.
| M/M % | SAAR % | Year/Year | |||||
| Jul-07 | Jun-07 | May-07 | 3-Mo | 6-Mo | 12-Mo | Yr Ago | |
| HICP Total | 0.0% | 0.2% | 0.2% | 2.0% | 2.1% | 1.2% | 2.2% |
| Core | #N/A | 0.1% | 0.1% | #N/A | #N/A | #N/A | 1.5% |
| CPI: All Items | 0.1% | 0.2% | 0.2% | 1.7% | 1.8% | 1.1% | 2.0% |
| CPI ex Food & Energy | 0.1% | 0.1% | 0.1% | 1.1% | 1.2% | 1.3% | 1.4% |
| Food | -0.2% | 0.5% | 0.1% | 1.9% | 0.4% | 0.8% | 2.1% |
| Alcohol | 0.3% | 0.4% | 0.4% | 4.5% | 3.4% | 0.6% | 0.2% |
| Clothing & Shoes | -0.7% | 0.2% | 0.2% | -1.4% | 1.2% | 0.2% | 0.2% |
| Rent & Utilities | 0.2% | 0.5% | 0.0% | 2.7% | 3.4% | 2.4% | 4.8% |
| Health Care | 0.4% | 0.0% | -0.1% | 1.1% | 0.3% | 0.4% | -0.2% |
| Transport | 0.2% | 0.4% | 0.7% | 5.0% | 6.1% | 1.5% | 4.0% |
| Communication | 0.0% | -0.1% | 0.1% | -0.1% | -3.8% | -0.6% | -6.2% |
| Recreation & Culture | -0.2% | 0.1% | -0.3% | -2.0% | -0.9% | -1.6% | -0.9% |
| Education | 0.2% | 0.2% | 0.2% | 2.9% | 2.7% | 2.4% | 2.8% |
| Restaurant & Hotel | 0.5% | 0.3% | 0.2% | 4.4% | 3.7% | 2.9% | 2.3% |
| Other | 0.0% | 0.1% | 0.3% | 1.7% | 1.8% | 2.0% | 3.2% |
| 6-mo | 12-mo | Yr-Ago | |||||
| Diffusion | 54.5% | 63.6% | 45.5% | ||||
by Robert Brusca August 14, 2007
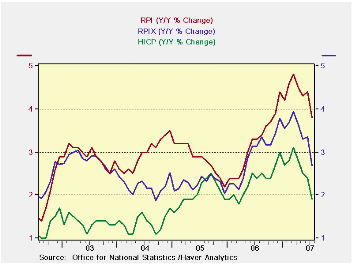
Inflation is slowing on a broad front in the UK in July - a quite unexpected development. Year/year, the Harmonized Index of Consumer Prices (HICP) is now below the 2% ceiling rate and suddenly that BOE inflation letter explaining why inflation had drifted above 3% seems oh so distant. The Retail Price Index (RPI) is still high but the Retail Price Index ex Mortgage Interest Payments (RPIX) tells the tale of sharply lower inflation too. Food costs are sharply lower. So are clothing and footwear, where price fell over three months.
This could be somewhat of a catalytic month for the BOE as well as for the ECB. Not only are we in the midst of financial turmoil at a time that the ECB had pointed strongly to a rate hike, but GDP growth has slowed. Now inflation, the reason for hiking rates is sharply lower, at least in the UK but also in France. Are things changing all that much or is this coincidence? Do you believe in Coincidence?
| M/M % Change | % SAAR | ||||||
| Jul-07 | Jun-07 | May-07 | 3-MO | 6-MO | 12-MO | Yr Ago | |
| HICP | -0.3% | 0.3% | 0.1% | 0.4% | 1.5% | 1.9% | 2.4% |
| RPI: All Items | -0.3% | 0.6% | 0.3% | 2.4% | 3.5% | 3.8% | 3.3% |
| RPIX (ex mortgage interest) | -0.3% | 0.5% | 0.2% | 1.4% | 2.3% | 2.7% | 3.1% |
| RPI ex seasonal food | -0.2% | 0.6% | 0.3% | 2.5% | 3.5% | 3.9% | 3.2% |
| Food & Beverages | -0.9% | 0.9% | 0.2% | 0.7% | 3.7% | 3.2% | 2.7% |
| Housing & HH Expenditures | -0.5% | 1.0% | 0.3% | 3.1% | 4.3% | 6.8% | 5.1% |
| Clothing & Footwear | 0.1% | 0.1% | -0.4% | -0.8% | 2.8% | 0.1% | -1.3% |
| Leisure Services | -0.1% | 0.3% | 0.2% | 1.9% | 1.3% | 2.8% | 2.1% |
| Leisure Goods | -0.1% | -1.4% | 0.1% | -5.6% | -4.8% | -3.0% | -2.5% |
| Motoring Expenditures | -0.4% | 0.7% | 1.0% | 5.2% | 3.9% | -0.3% | 3.1% |
| Fares and Travel Costs | 0.0% | 0.9% | 3.1% | 17.3% | 10.9% | 8.6% | 0.0% |
by Tom Moeller August 14, 2007
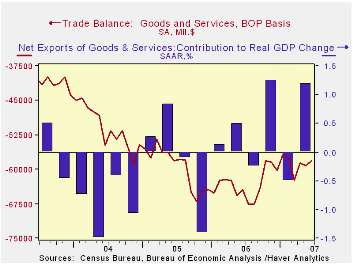
In June, the U.S. foreign trade deficit narrowed to $59.2B from a revised $59.2B in May. Consensus expectations had been for a deeper deficit of $62.0B.
Total exports jumped 1.5% after also surging 2.6% in May. The gain mostly reflected higher exports of industrial supplies. Exports of non-auto consumer goods fell 1.4% (+9.2% y/y) while capital goods exports rose just 0.2% (5.2% y/y). Exports of advanced technology goods rose a strong 8.5% (NSA, 9.0% y/y).
Exports of services from the U.S. were firm again and rose 0.6% (13.2% y/y) while imports of services rose the same 0.6% (4.7% y/y).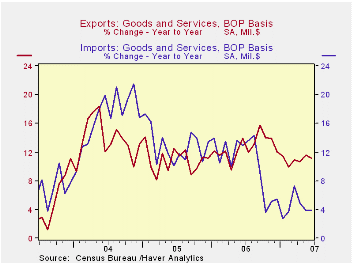
Imports of nonpetroleum products were strong again and increased 1.0% (4.6% y/y) but imports of petroleum products fell 0.2% (-1.1% y/y). Capital goods imports jumped again, in June by 1.6% (7.0% y/y) but imports of nonauto consumer goods fell 0.6% (+5.9% y/y). Imports of advanced technology products surged 8.3% (12.3% y/y).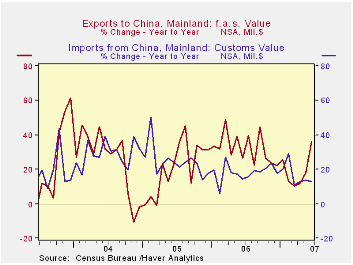
Globalization and Capital Markets: Implications for Inflation and the Yield Curve is a speech delivered by Fed Governor Randall S. Kroszner and it can be found here.
| Foreign Trade | June | May | Y/Y | 2006 | 2005 | 2004 |
|---|---|---|---|---|---|---|
| U.S. Trade Deficit | $58.1B | $59.2B | $64.5B (6/06) |
$758.5 | $714.4B | $612.1B |
| Exports - Goods & Services | 1.5% | 2.6% | 11.2% | 12.7% | 10.9% | 13.7% |
| Imports - Goods & Services | 0.5% | 2.1% | 3.8% | 10.4% | 12.9% | 16.8% |
by Tom Moeller August 14, 2007
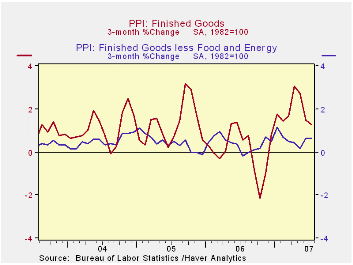
Finished producer prices rose 0.6% last month, twice the Consensus forecast for a 0.3% rise. That followed a 0.2% decline during June. The increase raised the y/y gain in prices to 3.9%, its highest in a year.
The core finished goods PPI increased a modest and expected 0.1%, down from the 0.3% gain in June. The increase was a bit below the average monthly increase of 0.2% so far this year.
Energy prices surged 2.5% as gasoline prices jumped 5.1% (6.4% y/y) and fuel oil prices rose 1.1% (1.6% y/y).Natural gas prices also were strong and posted a 3.2% (9.0% y/y) gain.
Food prices fell 0.1% (+6.2% y/y) following the 0.8% jump during June. Lower prices for meat and pork offset higher costs for dairy products. 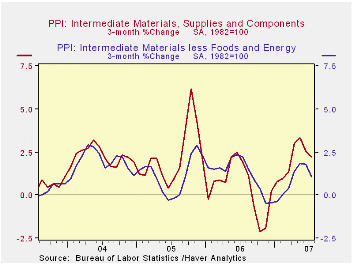
Finished consumer goods prices less food & energy rose 0.2% (2.4% y/y). Passenger car prices reversed the strong June gain with a 1.2% decline (+1.1% y/y) and household furniture prices also fell a modest 0.1% (NSA,+1.4% y/y).
Capital equipment prices fell 0.2% (+2.3% y/y) after a 0.1% uptick in June. Prices of light motor trucks fell and costs of heavy trucks were unchanged (6.8% y/y) for the third consecutive month.
Intermediate goods prices were firm again and rose 0.6% after a 0.5% June rise. Food prices were strong with a 0.8% (15.3% y/y) jump. The index excluding food & energy prices rose 0.2% (2.5% y/y).
The crude materials PPI jumped 1.2% due to the 11.8% rise in crude oil prices (-3.2% y/y). The core crude materials PPI was unchanged as most metal prices fell.
Inflation Dynamics, remarks by Federal Reserve Board Governor Frederic S. Mishkin, are available here.
| Producer Price Index | July | June | Y/Y | 2006 | 2005 | 2004 |
|---|---|---|---|---|---|---|
| Finished Goods | 0.6% | -0.2% | 3.9% | 2.9% | 4.9% | 3.6% |
| Core | 0.1% | 0.3% | 2.4% | 1.4% | 2.4% | 1.5% |
| Intermediate Goods | 0.6% | 0.5% | 3.9% | 6.4% | 8.0% | 6.6% |
| Core | 0.2% | 0.4% | 2.5% | 6.0% | 5.5% | 5.7% |
| Crude Goods | 1.2% | 0.3% | 13.2% | 1.4% | 14.6% | 17.5% |
| Core | 0.0% | -0.2% | 8.5% | 20.9% | 4.9% | 26.5% |
by Tom Moeller U.S. Small Business Optimism in July Recovered August 14, 2007
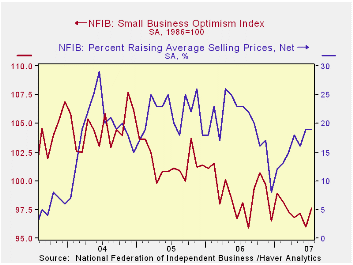
Small business optimism in July recovered most of its recent decline and rose 1.7% to the highest level since February, according to the National Federation of Independent Business (NFIB).
During the last ten years there has been a 70% correlation between the level of the NFIB index and the two quarter change in real GDP.
Respondents expecting the economy to improve improved but the percentage of firms with one or more job openings fell.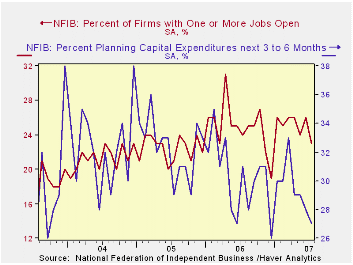
During the last ten years there has been a 72% correlation between the NFIB employment percentage and the y/y change in nonfarm payrolls.
The percent expecting higher sales in six months rose but remained at a fairly low level and the percentage of firms planning to raise capital expenditures fell back to near the three year low.
The percentage of firms actually raising prices was unchanged m/m but was near the highest level in nearly a year. During the last ten years there has been a 60% correlation between the change in the producer price index and the level of the NFIB price index.
About 24 million businesses exist in the United States. Small business creates 80% of all new jobs in America.
| Nat'l Federation of Independent Business | July | June | Y/Y | 2006 | 2005 | 2004 |
|---|---|---|---|---|---|---|
| Small Business Optimism Index (1986=100) | 97.6 | 96.0 | -0.5% | 98.9 | 101.6 | 104.6 |
by Tom Moeller August 14, 2007
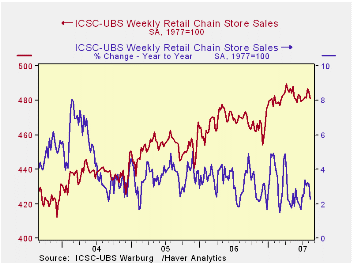
The ICSC-UBS retail chain-store sales index is constructed using the same-store sales (stores open for one year) reported by 78 stores of seven retailers: Dayton Hudson, Federated, Kmart, May, J.C. Penney, Sears and Wal-Mart.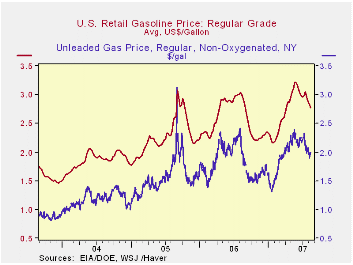
The leading indicator of chain store sales from ICSC-UBS rose 0.5% (1.8% y/y).
The recent weakness in chain store sales came as gasoline prices for regular, on average, fell 2.4% last week to $2.77 per gallon (-7.6% y/y).
The average gas price so far in August is 5.4% lower than in July and prices have fallen 13.9% from their peak during May of $3.22 per gallon.
The market price for regular gasoline in N.Y. harbor fell yesterday to $1.99 (-0.9% y/y), but that was up slightly from the July average price of $1.96.
| ICSC-UBS (SA, 1977=100) | 08/11/07 | 08/04/06 | Y/Y | 2006 |
|---|---|---|---|---|
| Total Weekly Chain Store Sales | 481.3 | 482.1 | 2.3% | 3.3% |
More Economy in Brief
 Global| Feb 05 2026
Charts of the Week: Balanced Policy, Resilient Data and AI Narratives
by:Andrew Cates


