 Global| Aug 14 2007
European GDP Growth Slows More Than Expected
Summary
According to Flash Estimates, growth in the Euro Area slowed more than expected in the second quarter to a rate of 0.3% from 0.7% in the first quarter.Consensus estimates suggested a rate of 0.5%. While details of the composition of [...]

According to Flash Estimates, growth in the Euro Area slowed more than expected in the second quarter to a rate of 0.3% from 0.7% in the first quarter.Consensus estimates suggested a rate of 0.5%. While details of the composition of GDP will not be available until September 3rd, other data suggest that the consumer held up well, but that growth in the manufacturing sector decelerated, as a result, in part, of the rise in the euro. The volume of retail sales increased 0.16% in the second quarter after a 0.05% decline in the first quarter. Manufacturing sales, however, rose only 1.29% in the second quarter after a 2.12% increase in the first quarter.
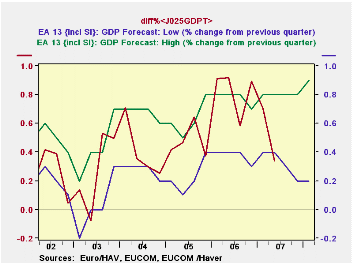
The European Commission projects a range of economic growth for three quarters ahead within which actual growth is expected to fall. As can be seen in the first chart which shows the actual growth and the range of estimates, the actual for the second quarter fell below the lower limit for the first time since the second quarter of 2003. Moreover, the range is widening, suggesting that the Commission is more uncertain about the future.
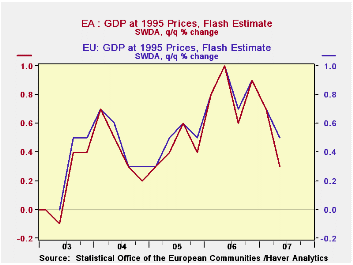
Among the Euro Area countries, German GDP fell from 0.5% in the first quarter to 0.3% in the second. For France, comparable figures were also 0.5% and 0.3%. Greece experienced a sharp decline from 3.2% in the first quarter to -0.8% in the second. For the 27 members of the European Union growth in the second quarter was 0.5%. Among the members outside the Euro Area that showed higher rates of growth were the UK at 0.8%, Sweden at 1.0% and Slovakia at 2.4%. Percent changes in GDP for the Euro Area and the European Union are shown in the second chart.
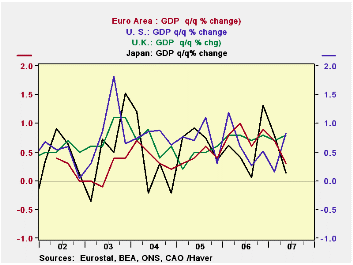
Growth in the Euro Area in the second quarter is now below that of the UK and the US, but is above that of Japan, as can be seen in the third chart.
| ESTIMATES OF REAL GDP CHANGE | Q1 08 | Q4 07 | Q3 07 | Q2 07 | Q1 07 |
|---|---|---|---|---|---|
| EURO AREA: Actual Q/Q % | -- | -- | -- | 0.3 | 0.7 |
| Forecast Range: High | 0.9 | 0.8 | 0.8 | 0.8 | 0.8 |
| Forecast Range: Low | 0.2 | 0.2 | 0.3 | 0.4 | 0.4 |
| EUROPEAN UNION: Actual Q/Q% | -- | -- | -- | 0.5 | 0.7 |
| UNITED KINGDOM: Actual Q/Q% | -- | -- | -- | 0.8 | 0.7 |
| JAPAN: Actual Q/Q% | -- | -- | -- | 0.1 | 0.8 |
| UNITED STATES | -- | -- | -- | 0.8 | 0.2 |
| SWEDEN | -- | --- | -- | 0.7 | 1.0 |
| GREECE | -- | -- | -- | -0.8 | 3.2 |
| SLOVAKIA | -- | -- | -- | 2.4 | 2.4 |
More Economy in Brief
 Global| Feb 05 2026
Charts of the Week: Balanced Policy, Resilient Data and AI Narratives
by:Andrew Cates


