 Global| Aug 11 2008
Evidence of Slow Down in Emerging Markets Coming to the Fore
Summary
Second quarter data on the national accounts of the emerging countries of the Pacific Rim are becoming available. More than two weeks ago, South Korea announced that its seasonally unadjusted second quarter GDP increased 4.8% over the [...]

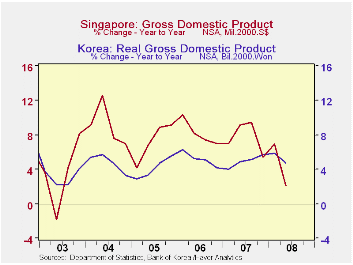
Second quarter data on the national accounts of the emerging countries of the Pacific Rim are becoming available. More than two weeks ago, South Korea announced that its seasonally unadjusted second quarter GDP increased 4.8% over the corresponding quarter of last year, down from a 5.8% increase in the first quarter. Today, Singapore announced that its second quarter increase over the same quarter of last year was up only 2.1%, compared with 6.9% for the first quarter. The year over year changes in the seasonally unadjusted real GDP for South Korea and Singapore are shown in the first chart.
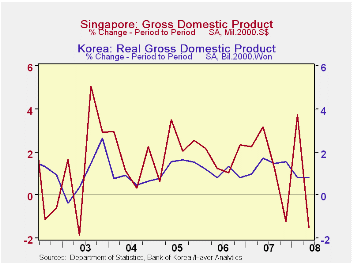
On a seasonally adjusted basis, South Korea's GDP increased 0.83% from the first to the second quarter, the same as in the first quarter from the fourth quarter of 2007. Singapore on the other hand, experienced a 1.5% decline in its second quarter GDP, compared with an increase of 3.72% in the first quarter, as shown in the second chart showing the period to period change in the seasonally adjusted data.
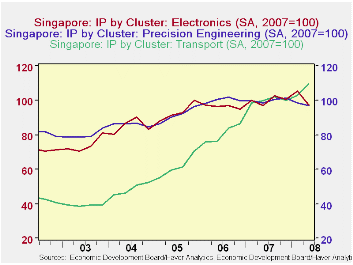
Singapore published data on production "clusters" about two weeks ago that suggested the slowing in the manufacturing sector would affect the second quarter GDP adversely. The third chart shows the indexes (2007=100) for three of the clusters: Electronics, Precision Engineering and Transport. The transport cluster continued to forge ahead in the second quarter but the Electronics and Precision Engineering clusters declined.


| SOUTH KOREA AND SINGAPORE | Q2 08 | Q1 08 | Q2 07 | Q/Q % chg | Y/Y % chg | 2007 | 2006 | 2005 |
|---|---|---|---|---|---|---|---|---|
| South Korea Real GDP (Bil 2000 Won) | ||||||||
| Seasonally Unadjusted | 206813 | 193700 | 197403 | -- | 4.77 | 798057 | 760251 | 723127 |
| Seasonally Adjusted | 207532 | 205829 | 198125 | 0.83 | -- | -- | -- | -- |
| Singapore GDP (Mil Singapore Dollar) | ||||||||
| Seasonally Unadjusted | 58219 | 58503 | 57019 | -- | 2.10 | 229090 | 212626 | 196474 |
| Seasonally Adjusted | 58558 | 59688 | 57535 | -1.52 | -- | -- | -- | -- |


