 Global| May 02 2005
Exchange Rates in the Pacific Rim
Summary
Ever since its sharp devaluation at the end of 1993, China has pegged its currency, the Yuan, (domestically known as the renminbi) to 8.277 to the US $. Recently, calls, particularly from the United States, for an appreciation of the [...]

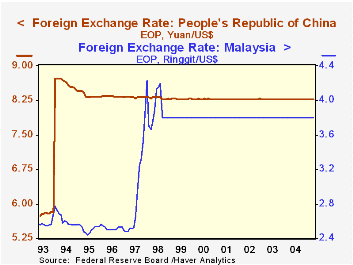
Ever since its sharp devaluation at the end of 1993, China has pegged its currency, the Yuan, (domestically known as the renminbi) to 8.277 to the US $. Recently, calls, particularly from the United States, for an appreciation of the currency have become ever more insistent as China's current account surplus and its reserves have risen sharply.
China has hinted that it might take gradual steps to free the currency, but no time frame has been set. Our purpose here, is not to try to guess when a change in the exchange regime will take place or what form it might take: a managed float, a free float or a simple appreciation to a new peg, but to take a look at the changes that have taken place in the various currencies of the Pacific Rim countries since the Chinese devaluation of 1993.
Hong Kong and Malaysia have also maintained fixed rates. The first chart, illustrating fixed rates, shows the Malaysian ringgit and the Chinese Yuan vs. the US dollar since 1993 when the Yuan was devalued. The ringgit was devalued during the crisis of 1996-7.
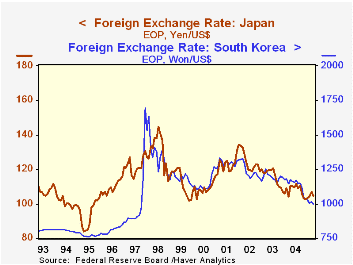
Many currencies, other than the Singapore dollar, were devalued at that time, but they, along with the Singapore dollar, were allowed, to a degree, to appreciate or devalue as market conditions warranted. The Japanese Yen and the South Korean Won relative to the US dollar, shown in the second chart, are typical of a relatively free currency regime. While China, Hong Kong, and Malaysia have unchanged rates of exchange since 1966, most of the other countries of the area, have witnessed periods of appreciation and devaluation
| Exchange Rates End of Period |
Apr 05 | 1993 | 1996 | App+/Deval- 93 to 97 | App+/Deval- 97 to Apr 05 | 2004 |
|---|---|---|---|---|---|---|
| China Yuan/$ | 8.277 | 5.8645 | 8.276 | -29.1 | 0.0 | 8.280 |
| Hong Kong/$ | 7.80 | 7.743 | 7.763 | 0.0 | 0.0 | 7.798 |
| Malaysia Ringgit/$ | 3.80 | 2.6950 | 3.80 | -29.1 | 0.0 | 3.80 |
| Japan Yen/$ | 104.64 | 111.70 | 102.13 | 8.8 | -1.9 | 118.57 |
| South Korea Won/$ | 997.0 | 811.30 | 1206.0 | -25.2 | 8.8 | 1186.30 |
| Thailand Baht/$ | 39.43 | 25.53 | 46.8 | -45.2 | 18.7 | 38.80 |
| India Rupee/$ | 43.48 | 31.44 | 35.94 | -12.5 | -17.3 | 43.27 |
| Singapore Dollar/$ | 1.6337 | 1.6085 | 1.3995 | 14.9 | -14.3 | 1.6319 |
| Taiwan Dollar/$ | 31.22 | 26.626 | 27.52 | -3.2 | -11.9 | 31.740 |
More Economy in Brief
 Global| Feb 05 2026
Charts of the Week: Balanced Policy, Resilient Data and AI Narratives
by:Andrew Cates


