 Global| Jan 28 2005
Exports Boost Korean Industry
Summary
Korean industrial production dipped in December, with the total down 1.9% and the manufacturing sector off 2.1%, according to industry data reported Friday by the National Statistics Office. Nonetheless, for 2004, factory output [...]

Korean industrial production dipped in December, with the total down 1.9% and the manufacturing sector off 2.1%, according to industry data reported Friday by the National Statistics Office. Nonetheless, for 2004, factory output surged by 10.5%, the strongest since the technology boom peaked in 2000.
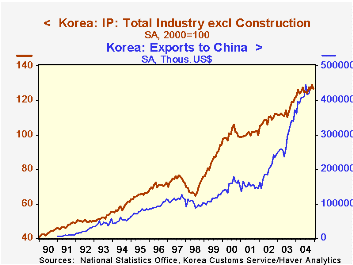
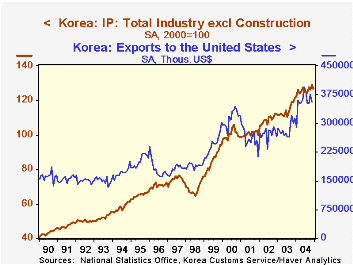
In examining these production data, we are impressed by two aspects, both trade related. The first is the sharp recovery following the currency crisis in 1997. Industrial output leaped ahead in 1999, by 24%, and again in 2000, by 17%. As we suggested above, this was perhaps related to the tech boom and the preparation for the Y2K calendar event. In addition, though, as evident in the accompanying graphs and the table below, a big, new market opened up for Korean products, China.
Korea's exports to China were $4.4 billion in November (latest available), some $836 million larger than those to the United States. The emergence of China as a trading partner for Korea has been rapid. Shipments to China surpassed those to the US only in July 2003. But shipments from Korea into other major markets remained larger than to China until very recently as well. Exports to Taiwan, Singapore, Germany and the UK were larger until 1992. Shipments to Hong Kong, until 1996 and to Japan until early 2001. Thus, China's share of Korea's exports -- and therefore its importance to Korean industry -- was well down the list of major customer markets. Now it is the number one importer of Korean goods, by about 20% over the United States. And China's business probably helped Korean industry grow in 2002 and 2003 when shipments to the US were still somewhat sluggish.
| South Korea: IP related to Exports | Dec 2004 | Nov 2004 | Year Ago | 2004 | 2003 | 2002 | 2001 |
|---|---|---|---|---|---|---|---|
| Industrial Production - Total (% Chg) | -1.9 | 2.1 | 4.5 | 10.1 | 5.1 | 8.1 | 0.7 |
| IP - Manufacturing (% Chg) | -2.1 | 2.2 | 4.6 | 10.5 | 5.1 | 8.2 | 0.2 |
| Total Exports of Goods (Mil.$) | 22,993 | 22,630 | 17,706 | 21,118* | 16,153 | 13,539 | 12,537 |
| Exports to US (Mil.$) | NA | 3,558 | 3,014 | 3,575* | 2,852 | 2,732 | 2,601 |
| Exports to China (Mil.$) | NA | 4,394 | 3,397 | 4,124* | 2,926 | 1,979 | 1,516 |
Carol Stone, CBE
AuthorMore in Author Profile »Carol Stone, CBE came to Haver Analytics in 2003 following more than 35 years as a financial market economist at major Wall Street financial institutions, most especially Merrill Lynch and Nomura Securities. She has broad experience in analysis and forecasting of flow-of-funds accounts, the federal budget and Federal Reserve operations. At Nomura Securites, among other duties, she developed various indicator forecasting tools and edited a daily global publication produced in London and New York for readers in Tokyo. At Haver Analytics, Carol is a member of the Research Department, aiding database managers with research and documentation efforts, as well as posting commentary on select economic reports. In addition, she conducts Ways-of-the-World, a blog on economic issues for an Episcopal-Church-affiliated website, The Geranium Farm. During her career, Carol served as an officer of the Money Marketeers and the Downtown Economists Club. She has a PhD from NYU's Stern School of Business. She lives in Brooklyn, New York, and has a weekend home on Long Island.


