 Global| Dec 13 2005
Fed Funds Rate Raised to 4.25%
by:Tom Moeller
|in:Economy in Brief
Summary
The target interest rate for Federal funds was raised 25 basis points to 4.25% at the latest meeting of the Federal Open Market Committee. The unanimous decision was widely expected by analysts. The discount rate also was raised 25 [...]
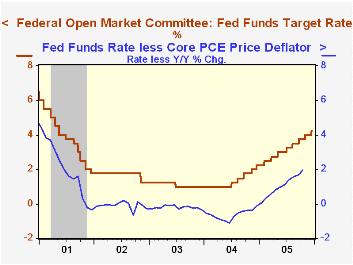
The target interest rate for Federal funds was raised 25 basis points to 4.25% at the latest meeting of the Federal Open Market Committee. The unanimous decision was widely expected by analysts. The discount rate also was raised 25 basis points to 5.25%. This latest increase was the thirteenth since June of 2004.
Today's press release from the Fed expressed clear concern about pending inflationary pressure. "... possible increases in resource utilization as well as elevated energy prices have the potential to add to inflation pressures."
As a result of this concern, "further measured policy firming is likely to be needed to keep the risks to the attainment of both sustainable economic growth and price stability roughly in balance."
For the complete text of the Fed's latest press release please click here.
Monetary Policy and the Term Structure of Interest Rates from the Federal Reserve Bank of Richmond can be found here.Model Uncertainty and Policy Evaluation: Some Theory and Empirics from the Federal Reserve Bank of San Francisco can be found here.
U.S. Retail: Less Spent on Gasoline, More on Other Stuffby Tom Moeller December 13, 2005
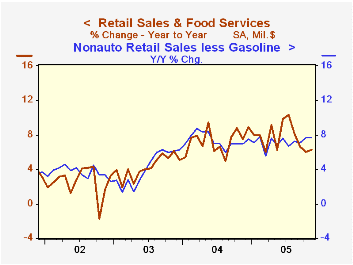
US retail sales increased 0.3% for the third straight month in November. The increase about matched Consensus expectations for a 0.4% rise and October's gain was upwardly revised. Less autos, retail sales fell 0.3% versus expectations for no change.
A 16.9% drop in pump prices weighed heavily on last month's sales tally and it fostered a 5.9% m/m drop in sales at gasoline service stations. Gas prices in December have stabilized w/w around $2.17 per gallon, down a dime from the November average.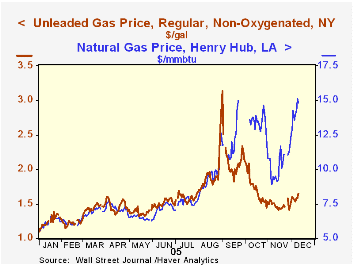
Less gasoline, nonauto retail sales rose 0.5% (7.6% y/y) following a little revised 1.0% October gains. For the fourth straight month sales at building material & supply dealers ballooned, last month by 1.9% (14.5% y/y).
Discretionary spending continued firm and added marginally to strong October gains. Apparel store sales added 0.2% (7.3% y/y) to a 2.6% pop and general merchandise store sales rose 0.1% (6.7% y/y) on top of a strong 1.1% October increase.
A little less firm were sales at furniture & electronics stores which rose just 0.1% (6.6% y/y) following a 0.3% drop in October. Sales of nonstore retailers (internet & catalogue) also fell by 0.2% (10.3% y/y) after a 0.8% October increase.
| Nov | Oct | Y/Y | 2004 | 2003 | 2002 | |
|---|---|---|---|---|---|---|
| Retail Sales & Food Services | 0.3% | 0.3% | 6.3% | 7.3% | 4.3% | 2.5% |
| Excluding Autos | -0.3% | 0.8% | 8.7% | 8.2% | 4.7% | 3.3% |
by Tom Moeller December 13, 2005
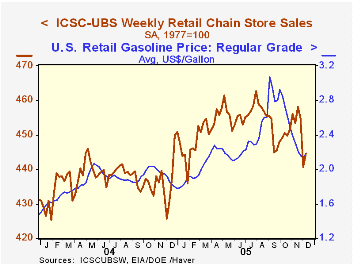
Lower chain store sales in December were accompanied by retail gasoline prices which crept higher to $2.19 per gallon (18.3% y/y) after two weeks at the cycle's low of $2.15. In addition, the spot market price for unleaded gasoline yesterday rose to $1.65 per gallon, up more than 20 cents (16%) from the November low. Perhaps looming larger is the spike in natural gas prices. Yesterday's spot price of $14.8 mmbtu easily doubled last year's and that gain adds to an increase in retail costs which through October totaled 45.3% y/y).
During the last ten years there has been a 51% correlation between the y/y change in chain store sales and the change in non-auto retail sales less gasoline, as published by the US Census Department. Chain store sales correspond directly with roughly 14% of non-auto retail sales less gasoline. The leading indicator of chain store sales from ICSC added 0.2% (-0.3% y/y) to the 1.0% surge the prior week.The ICSC-UBS retail chain-store sales index is constructed using the same-store sales (stores open for one year) reported by 78 stores of seven retailers: Dayton Hudson, Federated, Kmart, May, J.C. Penney, Sears and Wal-Mart.
| ICSC-UBS (SA, 1977=100) | 12/10/05 | 12/03/05 | Y/Y | 2004 | 2003 |
|---|---|---|---|---|---|
| Total Weekly Chain Store Sales | 444.5 | 440.6 | 3.2% | 4.6% | 2.9% |
by Tom Moeller December 13, 2005
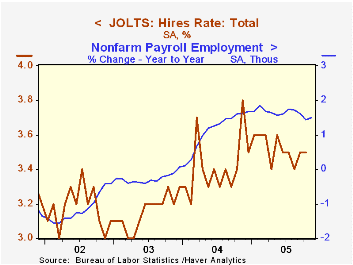
The Bureau of Labor Statistics reported that the job openings rate, from the Job Openings & Labor Turnover Survey (JOLTS), rose again in October suggesting a further firming of the US job market. The rate rose to 2.9% from an upwardly revised 2.8% in September and from 2.4% one year ago. The job openings rate is the number of job openings on the last business day of the month as a percent of total employment plus job openings.
The actual number of job openings rose 156,000 (21.0% y/y) to four million.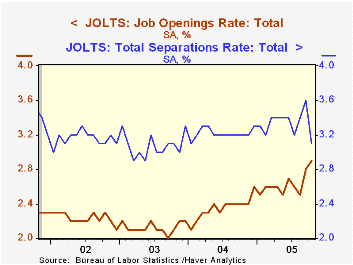
The job separations rate dropped sharply to 3.1% from an upwardly revised 3.6% in September and for the first time this year fell below the 2004 average of 3.2%. Total separations include quits, layoffs, discharges, and other separations as well as retirements. The total separations, or turnover, rate is the total number of separations during the month divided by employment.
The hires rate held steady at 3.5% versus an upwardly revised September level. The hires rate is the number of hires during the month divided by employment.
The survey dates only to December 2000 but has since followed the movement in nonfarm payrolls.
A description of the Jolts survey and the latest release from the U.S. Department of Labor is available here.
| JOLTS (Job Openings & Labor Turnover Survey) | Oct | Sept | Oct '04 | 2004 | 2003 | 2002 |
|---|---|---|---|---|---|---|
| Job Openings Rate: Total | 2.9% | 2.8% | 2.4% | 2.4% | 2.1% | 2.2% |
| Hires Rate: Total | 3.5% | 3.5% | 3.4% | 3.4% | 3.2% | 3.2% |
by Tom Moeller December 13, 2005
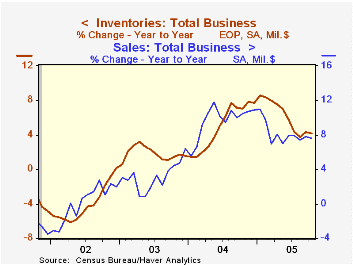
Total business inventories rose 0.3% in October following an unrevised 0.5% gain the prior month. Despite these increases, the ratio of inventories-to-sales held at the record low of 1.25 as business sales increased 0.8% (7.6% y/y).
Business' hesitancy to build inventory is evident from several aspects of the latest release. While the annual growth in business sales has slowed to 7.6% from 9.7% during all of 2004, the growth in inventories has nearly halved to 4.1% from 7.7% last year. And the following detail underscore that hesitancy.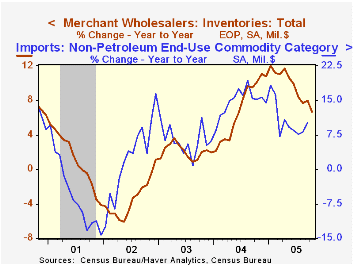
Retail inventories rose just 0.1% and even that small addition was due to a 0.7% rise in motor vehicle inventories which followed large additions during the prior two months. Excluding autos, inventories fell 0.1% and the September increase was revised sharply lower. Clothing inventories managed a 0.3% (5.7% y/y) but general merchandise fell 0.1% (+6.2% y/y). Inventories of furniture fell by 0.3% (+5.8% y/y) for the fourth consecutive down month.
Wholesale inventories rose just 0.2%. During the last ten years there has been a 66% correlation between the y/y change in wholesale inventories and the change in imports of nonpetroleum goods.
Factory sector inventories jumped 0.6% led by a 3.7% surge at petroleum refineries.
| Business Inventories | Oct | Sept | Y/Y | 2004 | 2003 | 2002 |
|---|---|---|---|---|---|---|
| Total | 0.3% | 0.5% | 4.1% | 7.7% | 1.4% | 1.6% |
| Retail | 0.1% | 0.8% | 1.7% | 5.7% | 3.9% | 5.9% |
| Retail excl. Autos | -0.1% | 0.1% | 5.1% | 5.9% | 2.0% | 2.3% |
| Wholesale | 0.2% | 0.6% | 6.6% | 10.8% | 2.0% | 1.2% |
| Manufacturing | 0.6% | 0.1% | 4.7% | 7.7% | -1.1% | -5.4% |
by Tom Moeller December 13, 2005
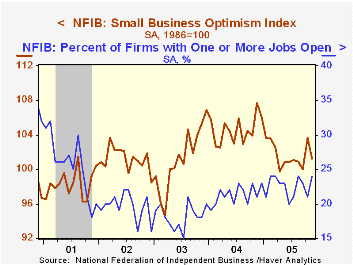
The index of small business optimism from the National Federation of Independent Business (NFIB) fell 2.4% last month and reversed much of October's improvement.
The decline was due to fewer (11%) firms expecting the economy to improve. Plans for adding to employment fell to 13% from the high 17% of the last three months but the number of firms with job openings increased to the cycle's high of 24%. The percentage of firms planning to raise capital expenditures surged to 34%, the highest since March.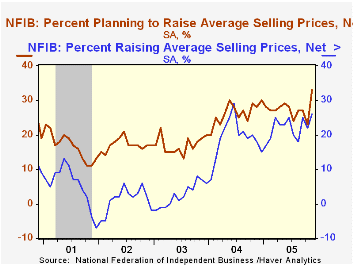
During the last ten years there has been a 70% correlation between the level of the NFIB index and the two quarter change in real GDP.
The percentage of firms planning to raise average selling prices rebounded to 33%, the highest level in over twenty years. The percentage of firms actually raising prices also rose. During the last ten years there has been a 60% correlation between the change in the producer price index and the level of the NFIB price index.
About 24 million businesses exist in the United States. Small business creates 80% of all new jobs in America.
The latest press release from the NFIB is available here.
| Nat'l Federation of Independent Business | Nov | Oct | Y/Y | 2004 | 2003 | 2002 |
|---|---|---|---|---|---|---|
| Small Business Optimism Index (1986=100) | 101.2 | 103.7 | -6.0% | 104.6 | 101.3 | 101.2 |
by Louise Curley December 13, 2005
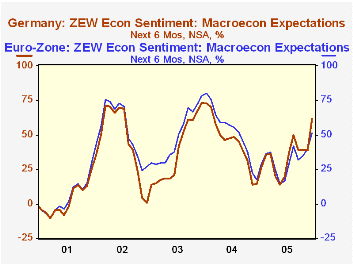
The ZEW survey of institutional investors and analysts showed a 22.9 point increase in expectations for improvement in the German economy six months ahead. This was the second largest month-to-month increase recorded since the series began in January 1992. The largest increase, 31.5, occurred in July 1993. Relief that the much of the uncertainty arising out of the recent election has abated may have been part of the reason for the increased confidence. But, the strength in exports and increased business investment in the third quarter may also have played a role in the increased confidence. Aided by a weaker Euro--the Euro has declined some 13% since early this year--goods export growth in the third quarter rose to 5.2% compared with 1.0% and 1.8% increases in the second and first quarters of this year. Expenditures on business equipment rose 3.8% in the third quarter compared to increases of 0.6% in the second quarter and 1.6% in the first.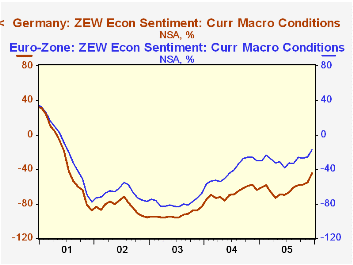
The respondents to the survey were somewhat less pessimistic about the current economic conditions. Pessimists outweighed optimists by 44.6% in December, down from 55.2% in November and 64.2% in December of a year ago. The continued dissatisfaction with current conditions may be due to the continued sluggishness in the consumer related areas of consumer spending and residential construction. The quarterly increases in consumer spending have been -0.27%, 0.18% and -0.03% in the first, second and third quarters of this year while the corresponding figures for residential construction have been -2.56%, 0.59% and 0.89%.
The ZEW survey also queries its respondents on current conditions and expectations for improvement in the next six months in the economy of the Euro Zone as a whole. Expectations for improvement in the economy six moths ahead in Germany and in the Euro Zone are show in the first chart. Over the past five years expectations for all of the Euro Zone, including Germany, have generally been greater than those for Germany alone. This year expectations for the German economy appear to be improving relative to the Euro Zone as a whole.
In terms of opinions on current conditions in the Euro Zone and Germany, shown in the second chart, the respondents to the ZEW survey are generally more pessimistic about the German economy than for the Euro Zone economy as a whole.
| ZEW Financial Market Survey | Dec 05 % bal |
Nov 05 % bal |
Dec 04 % bal |
M/M Dif | Y/Y Dif | 2005 % bal |
2004 % bal |
2003 % bal |
|---|---|---|---|---|---|---|---|---|
| Germany | ||||||||
| Current Conditions | -44.4 | -55.2 | -64.2 | 10.8 | 19.8 | -61.8 | -67.7 | -92.6 |
| Expectations 6 Months Ahead | 61.6 | 38.7 | 14.4 | 22.9 | 49.2 | 34.8 | 44.6 | 38.4 |
| Euro Zone | ||||||||
| Current Conditions | -16.8 | -2.55 | -30.2 | 8.7 | 13.4 | -28.7 | -41.4 | -78.5 |
| Expectations 6 Months Ahead | 51.2 | 40.0 | 17.7 | 11.2 | 33.5 | 32.3 | 57.1 | 48.9 |

Tom Moeller
AuthorMore in Author Profile »Prior to joining Haver Analytics in 2000, Mr. Moeller worked as the Economist at Chancellor Capital Management from 1985 to 1999. There, he developed comprehensive economic forecasts and interpreted economic data for equity and fixed income portfolio managers. Also at Chancellor, Mr. Moeller worked as an equity analyst and was responsible for researching and rating companies in the economically sensitive automobile and housing industries for investment in Chancellor’s equity portfolio. Prior to joining Chancellor, Mr. Moeller was an Economist at Citibank from 1979 to 1984. He also analyzed pricing behavior in the metals industry for the Council on Wage and Price Stability in Washington, D.C. In 1999, Mr. Moeller received the award for most accurate forecast from the Forecasters' Club of New York. From 1990 to 1992 he was President of the New York Association for Business Economists. Mr. Moeller earned an M.B.A. in Finance from Fordham University, where he graduated in 1987. He holds a Bachelor of Arts in Economics from George Washington University.
More Economy in Brief

 Global| Feb 05 2026
Charts of the Week: Balanced Policy, Resilient Data and AI Narratives
by:Andrew Cates

