 Global| May 08 2006
Fewer Jobs in Retail - Fluke or a Telling Indicator?
by:Tom Moeller
|in:Economy in Brief
Summary
The disappointing 138,000 rise in nonfarm payrolls during April generated questions. Was it typical of a series sometimes buffeted by aberrant forces, both real & statistical, or was there a fundamental pressure newly exposed? The [...]
The disappointing 138,000 rise in nonfarm payrolls during April generated questions. Was it typical of a series sometimes buffeted by aberrant forces, both real & statistical, or was there a fundamental pressure newly exposed?
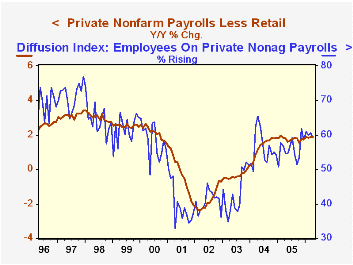
The disappointment was caused by a 36,100 drop in retail employment. Less that decline, m/m growth in private nonfarm payrolls actually improved to 167,100 (1.9% y/y) from 155,700 during March and from 150,200 per month during the last year.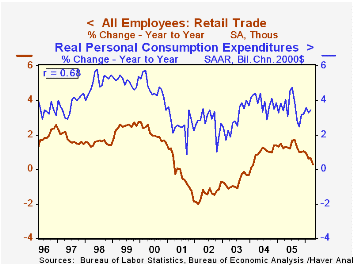
And the job gains outside of retail were fairly broad based. The diffusion index of private sector employment growth last month, which is a measure of breadth, stood at 59.2%, just off the year to date average of 60.2% and up from 55.8% last year.
Strength in the labor market was further suggested by the nine cent rise in average hourly earnings to $16.61 which pulled the y/y growth rate to its highest level (3.8%) since 2001 as well as an unemployment rate at a five year low of 4.7%.
The question becomes whether there was/is news in the decline in retail jobs? Retail employment rose an average 8,500 per month in the year ended March. Therefore April's decline did break a trend that already had slowed from a 13,400 monthly average gain during 2005. Does it portend slower consumer spending growth?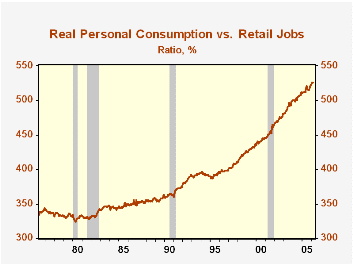
The recent strength in consumer spending clearly has been a factor driving the growth in retail jobs. During the last ten years there has been a 69% correlation between the y/y change in retail employment and the growth in real personal consumption. The problem with making too much of this relationship is that it fails to account for efficiencies in the retail sector. During the last 25 years, the real dollar volume of sales generated by a retail worker has nearly doubled. Pick a reason; "Big box" retailers, improved in-store efficiencies, the internet, catalogue shopping.
Therefore, it is premature to suggest that consumer spending growth is about to tank based on the indication that retail employment fell during April. Retailers may have some prescient, telling instinct, but for the moment the evidence is distinctly unclear.
| Employment | April | Mar | Y/Y | 2005 | 2004 | 2003 |
|---|---|---|---|---|---|---|
| Private Nonfarm Payrolls | 131,000 | 179,000 | 1.6% | 1.7% | 1.3% | -0.4% |
| Retail | -36,100 | 23,300 | 0.3% | 1.3% | 0.9% | -0.7% |
| Total less Retail | 167,100 | 155,700 | 1.9% | 1.7% | 1.3% | -0.3% |
by Louise Curley May 8, 2006
TheDirectorate-General for Economic and Financial Affairs of the European Commission released its Spring 2006 Economic Forecasts. The complete document can be found here.
Forecasts for 2006 and 2007 are given for the twenty-five countries of the European Union, the candidate countries--Bulgaria, Romania, and Turkey--and Croatia, the former Yugoslav Republic of Macedonia, the U. S. Japan and China.
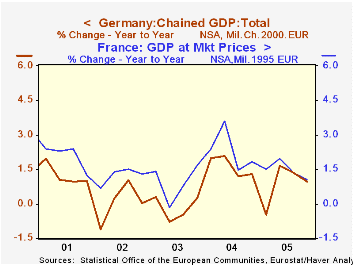
The Commission is forecasting growth in 2006 of 2.3% for the European Union, 0.2% higher than forecast six months ago. For the Euro Zone the forecast is 2.1%. For 2007 GDP growth for the European Union is forecast at 2.2%. The decline is due largely to forecasts for the Euro Zone, particularly Germany, where the increase in the Value Added Tax (VAT) rate by 3 percentage points on January 1, 2007 is expected to dampen consumption.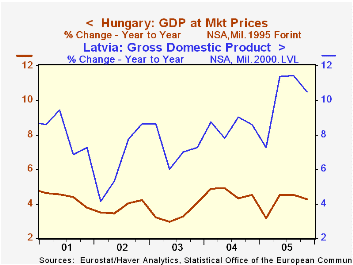
Data on the past growth trends among the various countries of the European Union, comparable to the forecast data, can be found in the Haver Data Base--EUROSTAT. (For the non European countries, see their individual data bases.) Trends in economic growth among the EU countries have varied widely over the past four years. The Euro Zone countries have generally shown sub par performance while those in Central and Eastern Europe and in the Baltics have shown considerable dynamism. The first chart shows the year-to-year percentage changes in the Gross Domestic Product for France and Germany while the second chart shows comparable data for Latvia and Hungary.
| GDP Rate of Change (%) | 2002 | 2003 | 2004 | 2005 | 2006F | 2007F |
|---|---|---|---|---|---|---|
| European Union | 1.2 | 1.2 | 2.4 | 1.6 | 2.3 | 2.2 |
| Euro Zone | 0.9 | 0.7 | 2.0 | 1.3 | 2.1 | 1.8 |
| France | 1.2 | 0.8 | 2.3 | 1.4 | 1.9 | 2.0 |
| Germany | 0.1 | -0.2 | 1.6 | 0.9 | 1.7 | 1.0 |
| Latvia | 6.5 | 7.2 | 8.5 | 10.2 | 7.5 | 7.6 |
| Hungary | 3.8 | 3.4 | 4.6 | 4.1 | 4.6 | 4.2 |

Tom Moeller
AuthorMore in Author Profile »Prior to joining Haver Analytics in 2000, Mr. Moeller worked as the Economist at Chancellor Capital Management from 1985 to 1999. There, he developed comprehensive economic forecasts and interpreted economic data for equity and fixed income portfolio managers. Also at Chancellor, Mr. Moeller worked as an equity analyst and was responsible for researching and rating companies in the economically sensitive automobile and housing industries for investment in Chancellor’s equity portfolio. Prior to joining Chancellor, Mr. Moeller was an Economist at Citibank from 1979 to 1984. He also analyzed pricing behavior in the metals industry for the Council on Wage and Price Stability in Washington, D.C. In 1999, Mr. Moeller received the award for most accurate forecast from the Forecasters' Club of New York. From 1990 to 1992 he was President of the New York Association for Business Economists. Mr. Moeller earned an M.B.A. in Finance from Fordham University, where he graduated in 1987. He holds a Bachelor of Arts in Economics from George Washington University.


