 Global| Mar 22 2013
FHFA Home Price Index Continues to Firm
by:Tom Moeller
|in:Economy in Brief
Summary
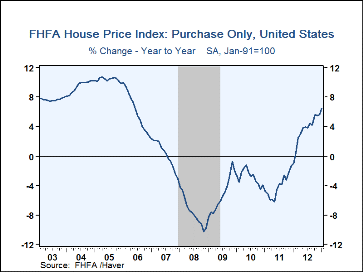
The U.S. House Price Index from the Federal Housing and Finance Agency (FHFA) rose another 0.6% during January following three consecutive months of similar increase. The 6.5% y/y rise was its strongest since the middle of 2006; it [...]
The U.S. House Price Index from the Federal Housing and Finance Agency (FHFA) rose another 0.6% during January following three consecutive months of similar increase. The 6.5% y/y rise was its strongest since the middle of 2006; it followed four successive years of price decline. Despite the improvement, prices remained 13.1% below the 2007 average.
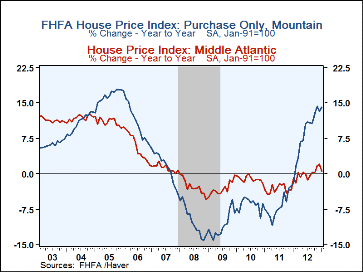
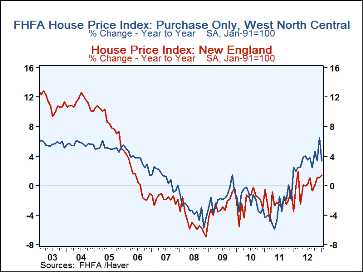
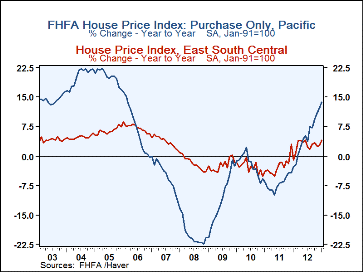
Home price appreciation was broad-based in the U.S. It was most notable in the Mountain (14.1% y/y) and Pacific (13.7% y/y) states. Lesser gains were logged across the country; prices in the Mid-Atlantic region were up just 0.4% y/y.
The FHFA house price index is a weighted repeat sales index. It measures average price changes in repeat sales or refinancings on the same properties. It is based on transactions involving conforming, conventional mortgages purchased or securitized by Fannie Mae or Freddie Mac. Only mortgage transactions on single family properties are included. The FHFA data is available in Haver's USECON database.
| FHFA U.S. House Price Index Purchase Only (SA %) | Jan | Dec | Nov | Y/Y | 2012 | 2011 | 2010 |
|---|---|---|---|---|---|---|---|
| Total | 0.6 | 0.5 | 0.5 | 6.5 | 3.5 | -4.1 | -2.9 |
| New England | -0.7 | 0.4 | 0.8 | 1.4 | -0.1 | -2.2 | -2.3 |
| Middle Atlantic | -0.3 | -0.0 | 1.1 | 0.4 | -0.0 | -3.2 | -1.1 |
| East North Central | 0.6 | 0.6 | -1.2 | 3.8 | 2.2 | -3.7 | -3.2 |
| West North Central | 0.1 | 0.8 | 0.2 | 3.4 | 3.4 | -3.3 | -2.0 |
| South Atlantic | 1.0 | -0.1 | 0.6 | 7.4 | 4.1 | -5.2 | -4.8 |
| East South Central | -0.5 | 2.0 | -0.6 | 4.1 | 2.6 | -2.6 | -2.8 |
| West South Central | 0.5 | 0.4 | 0.4 | 6.8 | 4.3 | -1.1 | -0.3 |
| Mountain | 0.9 | 0.1 | 2.0 | 14.1 | 8.3 | -6.9 | -6.5 |
| Pacific | 1.6 | 1.0 | 1.8 | 13.7 | 4.9 | -7.0 | -2.2 |
Tom Moeller
AuthorMore in Author Profile »Prior to joining Haver Analytics in 2000, Mr. Moeller worked as the Economist at Chancellor Capital Management from 1985 to 1999. There, he developed comprehensive economic forecasts and interpreted economic data for equity and fixed income portfolio managers. Also at Chancellor, Mr. Moeller worked as an equity analyst and was responsible for researching and rating companies in the economically sensitive automobile and housing industries for investment in Chancellor’s equity portfolio. Prior to joining Chancellor, Mr. Moeller was an Economist at Citibank from 1979 to 1984. He also analyzed pricing behavior in the metals industry for the Council on Wage and Price Stability in Washington, D.C. In 1999, Mr. Moeller received the award for most accurate forecast from the Forecasters' Club of New York. From 1990 to 1992 he was President of the New York Association for Business Economists. Mr. Moeller earned an M.B.A. in Finance from Fordham University, where he graduated in 1987. He holds a Bachelor of Arts in Economics from George Washington University.


