 Global| Sep 17 2012
FIBER: Higher Lumber, Crude Oil & Metals Costs Lift Commodity Price Index
by:Tom Moeller
|in:Economy in Brief
Summary
Despite the weakening in factory sector activity, there's recently been broad-based strength in industrial commodity prices. At 169.5, the latest price index from the Foundation for International Business and Economic Research (FIBER) [...]


Despite the weakening in factory sector activity, there's recently been broad-based strength in industrial commodity prices. At 169.5, the latest price index from the Foundation for International Business and Economic Research (FIBER) recovered to its highest level since early-May and is roughly even with the level twelve months ago. During the last ten years there has been a 44% correlation between the three-month change in prices and the change in factory sector industrial production.
 Leading the advance were prices
in the miscellaneous group as they strengthened to a high for the
economic recovery. The gain was paced by surging prices for structural
panels (57.9% y/y) and framing lumber (31.7% y/y). Crude oil
prices have been similarly strong, rising to $98.31 per barrel (10.0% y/y) on Friday from a late-June low of
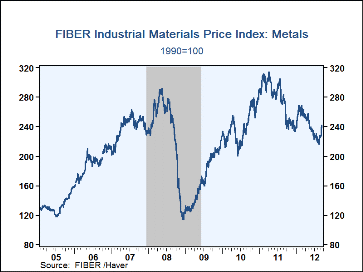
$77.79. In the metals group, the recent gain in prices
wasn't far behind, though they remained down y/y.
The roughly 10% recovery in just the last month was led by higher prices for aluminum and
copper scrap. Steel scrap prices, however, remain extremely depressed, down one-quarter
y/y.
Leading the advance were prices
in the miscellaneous group as they strengthened to a high for the
economic recovery. The gain was paced by surging prices for structural
panels (57.9% y/y) and framing lumber (31.7% y/y). Crude oil
prices have been similarly strong, rising to $98.31 per barrel (10.0% y/y) on Friday from a late-June low of
$77.79. In the metals group, the recent gain in prices
wasn't far behind, though they remained down y/y.
The roughly 10% recovery in just the last month was led by higher prices for aluminum and
copper scrap. Steel scrap prices, however, remain extremely depressed, down one-quarter
y/y.
Showing less strength has been textile prices. As of Friday, cotton prices gave back their August gain and still were roughly one-third below the year ago level.
Commodity price data can be found in Haver's DAILY, WEEKLY, USECON and CMDTY databases.

| FIBER Industrial Materials Price Index (1990=100) | 09/14/12 | Y/Y % | 2011 | 2010 | 2009 |
|---|---|---|---|---|---|
| All Items | 169.5 | -0.1 | 172.9 | 157.7 | 121.4 |
| Textiles | 77.1 | -7.8 | 86.1 | 81.2 | 73.3 |
| Cotton (cents per pound) | 68.9 | -35.8 | 132.6 | 87.8 | 52.2 |
| Metals | 238.1 | -12.8 | 278.5 | 239.9 | 167.9 |
| Aluminum ($ per metric ton) | 2,081.5 | -11.0 | 2,400 | 2,172 | 1,662 |
| Copper Scrap (cents per pound) | 365.3 | -7.5 | 400.1 | 326.5 | 195.2 |
| Steel Scrap ($ per ton) | 311.1 | -25.9 | 412.4 | 325.7 | 203.4 |
| Crude Oil & Benzene | 207.7 | 5.8 | 199.3 | 182.0 | 150.9 |
| Crude Oil (WTI, $ per Barrel) | 98.3 | 10.0 | 95.1 | 79.5 | 61.4 |
| Miscellaneous | 221.3 | 17.5 | 190.5 | 178.8 | 127.6 |
| Framing Lumber ($ per 1000 board ft.) | 341 | 31.7 | 273 | 282 | 221 |
| Natural Rubber (cents per pound) | 198.0 | -24.7 | 261.8 | 181.8 | 83.0 |

Tom Moeller
AuthorMore in Author Profile »Prior to joining Haver Analytics in 2000, Mr. Moeller worked as the Economist at Chancellor Capital Management from 1985 to 1999. There, he developed comprehensive economic forecasts and interpreted economic data for equity and fixed income portfolio managers. Also at Chancellor, Mr. Moeller worked as an equity analyst and was responsible for researching and rating companies in the economically sensitive automobile and housing industries for investment in Chancellor’s equity portfolio. Prior to joining Chancellor, Mr. Moeller was an Economist at Citibank from 1979 to 1984. He also analyzed pricing behavior in the metals industry for the Council on Wage and Price Stability in Washington, D.C. In 1999, Mr. Moeller received the award for most accurate forecast from the Forecasters' Club of New York. From 1990 to 1992 he was President of the New York Association for Business Economists. Mr. Moeller earned an M.B.A. in Finance from Fordham University, where he graduated in 1987. He holds a Bachelor of Arts in Economics from George Washington University.
More Economy in Brief

 Global| Feb 05 2026
Charts of the Week: Balanced Policy, Resilient Data and AI Narratives
by:Andrew Cates

