 Global| Dec 08 2006
Firm U.S. Payroll Report with Still More Upward Revisions
by:Tom Moeller
|in:Economy in Brief
Summary
Nonfarm payrolls in November rose 132,000 and though the gain in the prior month was reduced slightly, the net upward revision during September and October totaled 55,000 jobs. Consensus expectations for November had been for a [...]
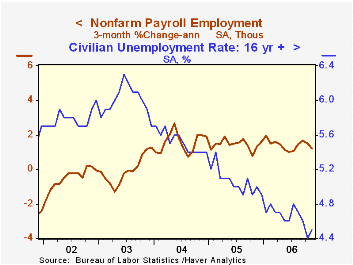
Nonfarm payrolls in November rose 132,000 and though the gain in the prior month was reduced slightly, the net upward revision during September and October totaled 55,000 jobs. Consensus expectations for November had been for a 108,000 rise.
During 2006 payrolls have risen an average 149,000 per month versus a monthly average 165,000 during all of last year. The gain during the second half of this year in addition has been a firm 153,000 per month.
From the household jobs survey, employment gains also showed strength and posted a 277,000 (2.1% y/y) gain last month after October's 437,000 surge. Year to date employment as measured by the household survey has risen an average 253,000 per month.
The unemployment rate did tick up to 4.5% last month due to a 383,000 (1.5% y/y) surge in the labor force, but that may also be an indication of labor market strength. It reflected a 153,000 decline in the number of persons not in the labor force. That raised the labor force participation rate to 66.3%, the highest level since early 2003.
Private service-producing jobs from the establishment survey rose 154,000 (1.7% y/y). Professional & business services employment rose 43,000 (2.5% y/y) after a downwardly revised 29,000 October increase. Temporary help services jobs rose 4,800 (-0.8% y/y) but education & health services jobs rose 41,000 (2.6% y/y). Leisure & hospitality jobs increased 31,000 (2.5% y/y) and financial sector jobs gained 11,000 (1.9% y/y).
Government payrolls increased 18,000 (1.1% y/y) but most of the gain owed to a 13,000 (1.5% y/y) increase in local government jobs.
Factory sector payrolls fell 15,000 following a deepened 44,000 decline during October. Jobs in motor vehicle & parts industries fell 6,900 (-3.8% y/y) while jobs in furniture fell 5,200 (-4.0% y/y). Nondurable sector factory employment fell 2,000 (-1.2% y/y) and declines were widespread.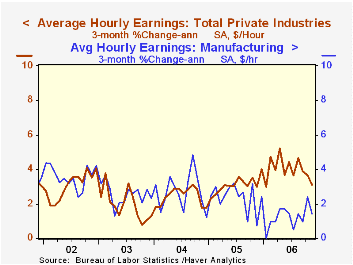
Construction employment dropped 29,000 (+0.7% y/y) after a little revised 24,000 decline during October. Since the August peak construction jobs have fallen 0.7%. That decline has been led by a 109,100 (-4.6%) drop in residential specialty trade contractors since this group of workers' peak employment month last February.
Average hourly earnings halved the previous month's increase and rose 0.2%. Factory sector earnings rose just 0.1% (1.4% y/y) after a large 0.4% October gain.
The workweek held at the high 33.9 hours, the highest level since 2002. As a result, aggregate hours worked so far in 4Q rose 1.5% (AR) from 3Q when they rose 1.1%.
Tracking Productivity in Real Time from the Federal Reserve Bank of new York can be found here.
| Employment | November | October | Y/Y | 2005 | 2004 | 2003 |
|---|---|---|---|---|---|---|
| Payroll Employment | 132,000 | 79,000 | 1.3% | 1.5% | 1.1% | -0.3% |
| Manufacturing | -15,000 | -44,000 | -0.4% | -0.6% | -1.3% | -4.9% |
| Average Weekly Hours | 33.9 | 33.9 | 33.8 (Nov. '05) | 33.8 | 33.7 | 33.7 |
| Average Hourly Earnings | 0.2% | 0.4% | 4.1% | 2.8% | 2.1% | 2.7% |
| Unemployment Rate | 4.5% | 4.4% | 5.0% (Nov. '05) | 5.1% | 5.5% | 6.0% |
by Tom Moeller December 8, 2006
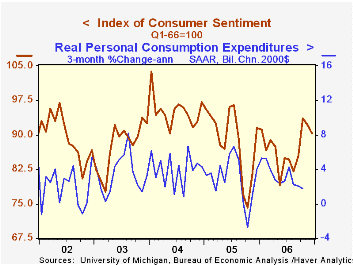
The University of Michigan's preliminary reading of consumer sentiment this month fell 2.1% from November to 90.2. The decline followed a 1.6% November drop and compared to Consensus expectations for a slight increase to 92.5.
During the last ten years there has been a 76% correlation between the level of consumer sentiment and the y/y change in real consumer spending and during those ten years sentiment has a 68% correlation with the change in nonfarm payrolls.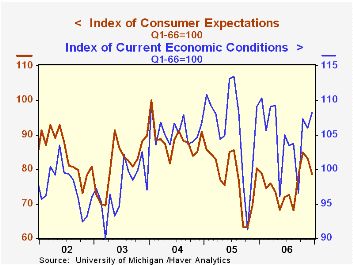
Diminished consumer expectations for the economy dragged the December figure down with a 5.5% decline after a 1.9% November shortfall. Business conditions during the next twelve months led that decline with a 13.4% (-6.7% y/y) drop while long term expected business conditions also fell as did expected personal finances.
The reading of current economic conditions actually rose 2.1% and reversed the 1.2% November drop. Perceived buying conditions for large household goods led that m/m increase (-1.2% y/y) but the sense of current personal finances fell (-0.8% y/y).
Expected inflation during the next year increased to 3.5% and for the next five years expected inflation ticked up to 3.6%. Since 1980 there has been an inverse 63% correlation between the level of sentiment and expected inflation during the next year.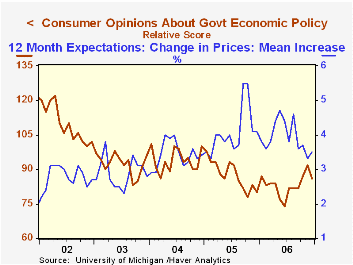
Consumers' opinion about gov't economic policy sagged miserably to an index reading of 86 and reversed all of November's increase.
The University of Michigan survey is not seasonally adjusted.The mid-month survey is based on telephone interviews with 250 households nationwide on personal finances and business and buying conditions. The survey is expanded to a total of 500 interviews at month end.
| University of Michigan | December (Prelim. | November | Y/Y | 2006 | 2005 | 2004 |
|---|---|---|---|---|---|---|
| Consumer Sentiment | 90.2 | 92.1 | -1.4% | 87.2 | 88.6 | 95.2 |
| Current Conditions | 108.2 | 106.0 | -0.8% | 105.1 | 105.9 | 105.6 |
| Expectations | 78.6 | 83.2 | -2.0% | 75.7 | 77.4 | 88.5 |
by Tom Moeller December 8, 2006
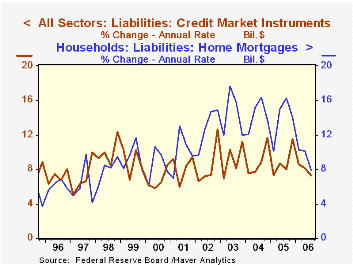
Credit market debt outstanding owed by all sectors of the economy grew 7.3% (AR, 8.8% y/y) during the third quarter, the slowest quarterly growth rate since early last year.
The slowdown reflected the federal government's debt which grew just 3.7% during 3Q and that slowed the y/y gain to 5.2%, half the growth rate of 2003. A 7.9% (10.6% y/y) rise in households' home mortgage liabilities also was the slowest since early 2001 and nearly half the rate of gain of just a year ago.
To the upside, consumer credit growth quickened to 10.2% (4.3% y/y), but households' obligations in the form of bank loans surged for the fourth straight quarter (58.1%, 134.6% y/y).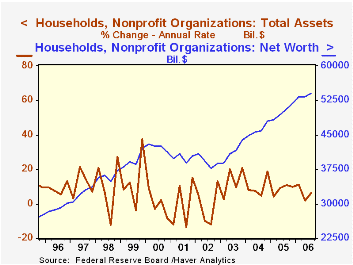
The net worth of the US household sector jumped 1.5% in 3Q versus 2Q'06 to a record $54.064 trillion.
On the asset side of the ledger, total assets of households and nonprofit organizations rose at a 6.6% rate (7.4 y/y). Households' ownership of real estate rose at just a 3.9% rate (8.3% y/y), the slowest rate of gain in ten years. Mutual fund share holdings rose at a 12.2% rate (16.1% y/y) and the value of corporate equities held directly by households rose 3.5% (-2.7% y/y). The value of money market shares rose at a 20.6% rate with higher interest rates (17.2% y/y) but Treasury security holdings fell for the second consecutive quarter (+15.6% y/y).
| Flow of Funds (Y/Y Chg.) | % of Total | 3Q'06 | 2Q'06 | 2005 | 2004 | 2003 |
|---|---|---|---|---|---|---|
| Total Credit Market Debt Outstanding | 8.8% | 9.0% | 8.9% | 8.9% | 9.1% | |
| Federal Government | 12% | 5.2% | 5.9% | 7.0% | 9.0% | 10.9% |
| Households | 27% | 9.7% | 11.1% | 11.7% | 11.7% | 11.7% |
| Nonfinancial Corporate Business | 14% | 7.3% | 7.1% | 5.5% | 3.7% | 2.3% |
| Financial Sectors | 32% | 9.6% | 9.2% | 8.2% | 8.1% | 9.9% |
| Net Worth: Households & Nonprofit Organizations (Trillions) | $54.064 | $53.288 | $51.762 | $47.962 | $43.968 | |
| Tangible Assets: Households | $26.542 | $26.245 | $25.173 | $22.524 | $20.239 | |
| Financial Assets: Households | $40.516 | $39.768 | $38.802 | $36.444 | $33.541 |
by Carol Stone December 8, 2006
The Federal Reserve's release yesterday of the quarterly Flow of Funds calls our attention once again to changing relationships highlighted in this enormous body of financial information. Here follow brief notes on two specific, but widely diverse sectors. These are Q3 data, of course, and this is early December, so there are some lags.
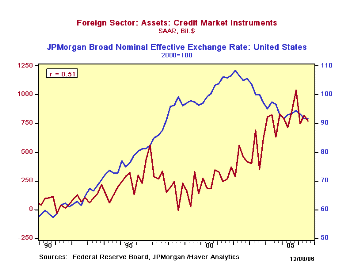
The general interpretation of foreign capital flows argues that foreign acquisition of US assets should be positively correlated with movements in the value of the dollar. Whichever way the causation goes, whether a rising dollar attracts foreign capital or larger foreign investment pushes up the dollar, one would think the relationship would show a positive correlation.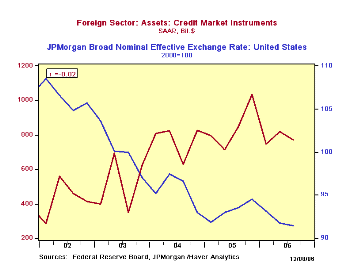
But since the dollar began to fall in 2002, this has not been the case. Foreign investment in the US has continued to increase anyway. See the table below and the accompanying graph. Overall correlation since 1990 is +51%; but from 2002 forward, the correlation shifts to -82%! The most recent three quarters of observations indicate some moderation in foreign acquisition of US assets, so perhaps this relationship is beginning to right itself. But it will be at least until the release of Q4 data in March before we know this.
Another wide use of the Flow of Funds data has come to prominence quite recently, the analysis of mortgage data to gauge borrowing against home equity as a source of funds for consumer spending. Staff members in the Research Division of the Board of Governors calculate two measures of this, which they call Home Equity Extraction. Their figures, part of a full model on the intricate operation of the mortgage and mortgage securities markets, are not yet available for Q3. Haver Analytics has devised our own simpler series, which tend to follow the movements in the Fed's data. Our version, which we call Home Equity Withdrawal, was updated yesterday, soon after the release of the Flow of Funds data. All of these series reside in the USECON database.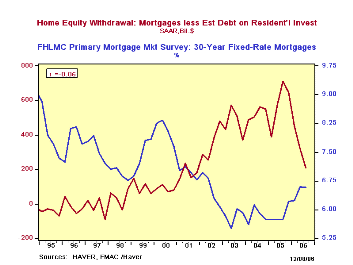
Q3 shows a steep drop in this form of consumer borrowing: to "just" $209.3 billion, SAAR, from $319.6 billion in Q2 and $712.3 billion a year ago, which was the peak in our measure. This is closely related to the rise in mortgage rates, which has discouraged the refinancing associated with such equity withdrawal. Some forecasters had looked for a retreat in equity withdrawal to contribute to a significant slowdown in consumer spending this year. So far this doesn't seem to have taken place, at least to the extent feared by some. In the very most recent months falling energy costs have helped to cushion spending on other items, offsetting some of the shrinkage in debt financing.
| FLOW-OF-FUNDS SAAR, Bil.$ |
Q3 2006 | Q2 2006 | 2005 | 2004 | Average, 2000-2003 | Average, 1995-1999 |
|---|---|---|---|---|---|---|
| Foreign Acquisition, Credit Market Instruments | 769.5 | 818.6 | 847.8 | 772.9 | 373.9 | 243.3 |
| Broad Value of $* | 91.4 | 91.8 | 93.2 | 95.5 | 103.1 | 87.9 |
| Home Equity Withdrawal** | 209.3 | 319.6 | 578.5 | 525.6 | 271.8 | 10.7 |

Tom Moeller
AuthorMore in Author Profile »Prior to joining Haver Analytics in 2000, Mr. Moeller worked as the Economist at Chancellor Capital Management from 1985 to 1999. There, he developed comprehensive economic forecasts and interpreted economic data for equity and fixed income portfolio managers. Also at Chancellor, Mr. Moeller worked as an equity analyst and was responsible for researching and rating companies in the economically sensitive automobile and housing industries for investment in Chancellor’s equity portfolio. Prior to joining Chancellor, Mr. Moeller was an Economist at Citibank from 1979 to 1984. He also analyzed pricing behavior in the metals industry for the Council on Wage and Price Stability in Washington, D.C. In 1999, Mr. Moeller received the award for most accurate forecast from the Forecasters' Club of New York. From 1990 to 1992 he was President of the New York Association for Business Economists. Mr. Moeller earned an M.B.A. in Finance from Fordham University, where he graduated in 1987. He holds a Bachelor of Arts in Economics from George Washington University.
More Economy in Brief


