 Global| Feb 11 2008
French IP Rebounds WithoutEnthusiasm
Summary
France's IP was kicked down in November as a transit strike slowed the France economy. A December rebound was expected. But the rebound is less that the November drop, stirring suspicions that growth may be more fundamentally impaired [...]
France's IP was kicked down in November as a transit strike
slowed the France economy. A December rebound was expected. But the
rebound is less that the November drop, stirring suspicions that growth
may be more fundamentally impaired in France. Certainly Q4 is looking
weaker. IP in the quarter to date period (which is now for the full
quarter) is up by just 1.1% SAAR. This compares with a 4.8% rise in the
previous quarter.
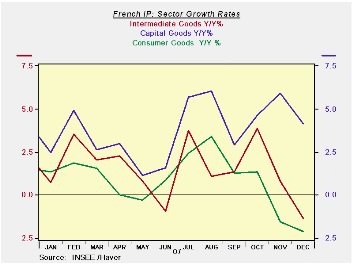
The sector growth rates do not show a consistent pattern. The
consumer sector by itself does show a clear trend to deceleration.
Intermediate goods output is waffling around zero. Capital goods output
is still strong. Strength in capital goods – or relative strength – is
one continuing feature of Euro Area economies. Even though the consumer
sector is weak capital goods output has remained strong with few
exceptions in Euro Area nations. The chart shows that consumer and
intermediate goods output trends are more of problem while the capital
goods trends continue to be firm.
| French IP excluding Construction | |||||||
|---|---|---|---|---|---|---|---|
| Saar except m/m | Dec-07 | Nov-07 | Oct-07 | 3-mo | 6-mo | 12-mo | Quarter-to-date |
| IP total | 0.7% | -1.7% | 2.0% | 3.9% | 3.3% | 1.2% | 1.1% |
| Consumer Goods | -0.4% | -1.9% | 0.3% | -7.8% | -4.2% | -2.1% | -7.8% |
| Capital Goods | 0.1% | 0.5% | 1.2% | 7.4% | 6.2% | 4.1% | 3.3% |
| Intermediate Goods | 0.0% | -1.9% | 1.8% | -0.4% | 0.0% | -1.3% | -1.5% |
| Memo | |||||||
| Auto | 3.5% | -5.0% | 6.4% | 19.6% | 15.2% | 5.4% | 9.2% |
by Robert Brusca February 11, 2008
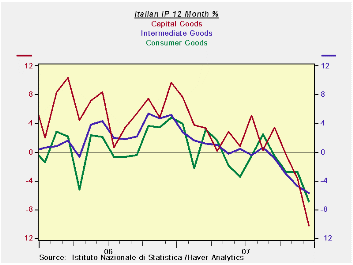
Italy is the most troubled of the large EMU economies. It’s
Industrial Output is declining on a clear downward trend. For its three
major sectors, Consumer goods, Intermediate goods and Capital goods
output trends are declining over horizons of three months, six months,
and twelve months. The degree of deceleration is becoming more intense.
Italy is the exception to the Euro Area economy ‘rule’ since
the output of even capital goods is weak there. Indeed, the capital
goods sector has the sharpest negative growth rate over three months at
-23.6%.
| Italy IP excluding construction | ||||||
|---|---|---|---|---|---|---|
| Saar except m/m | Dec-07 | Nov-07 | Oct-07 | 3-mo | 6-mo | 12-mo |
| IP-MFG | -0.5% | -1.7% | -0.8% | -11.5% | -6.7% | -6.4% |
| Consumer Goods | -1.4% | -0.3% | 0.0% | -6.6% | -3.2% | -6.8% |
| Capital Goods | -2.3% | -2.5% | -1.9% | -23.6% | -11.0% | -10.3% |
| Intermediate Goods | -0.3% | -1.4% | -0.6% | -8.9% | -6.7% | -5.7% |
| Memo | ||||||
| Transportation | -3.7% | -3.8% | 0.1% | -25.9% | -10.3% | -5.9% |
by Louise Curley February 11, 2008

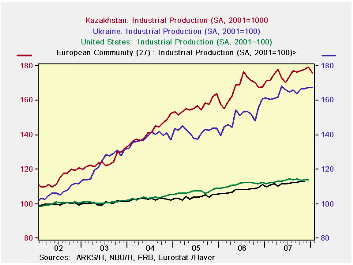
The preliminary data for January 2008 for industrial production in the Ukraine show a minimal increase of 0.06% and that for Kazakhstan, a 2% decline, as can be seen in the first chart. Industrial production in both countries, which has been growing faster than that in the United States and the European Community over the past several years appears to be slowing up, as can be seen in the second chart. (All the data have been indexed to 2001=100 for comparative purposes.)
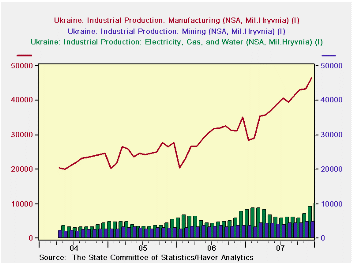
Data are available in the Ukraine for the value of production and its components. Machinery is by far the most important major component, as can be seen in the third chart. Given the value of industrial production it is possible to derive the importance of industrial production in the total economy. In 2006, industrial production accounted for about 7% of Gross Domestic Product, the value of production being 38.364 million Hryvania and Gross Domestic Product , 537,667 million Hryvania (5.05 Hryvania = $1.00).
| INDUSTRIAL
PRODUCTION SA, (2001=100) |
Jan 08 | Dec 07 | Nov 07 | Oct 07 | Sep 07 | 2007 %Chg | 2006 %Chg | 2005 %Chg | 2004 % Chg |
|---|---|---|---|---|---|---|---|---|---|
| Kazakhstan | 175.96 | 179.06 | 178.00 | 177.08 | 176.54 | 5.64 | 6.57 | 10.19 | 13.98 |
| Ukraine Domestic | 167.5 | 167.4 | 166.7 | 166.8 | 164.0 | 9.45 | 5.77 | 12.82 | 11.75 |
| European Community (27) | n.a. | n.a. | 112.77 | 113.32 | 112.36 | n.a. | 3.93 | 1.22 | 2.10 |

Robert Brusca
AuthorMore in Author Profile »Robert A. Brusca is Chief Economist of Fact and Opinion Economics, a consulting firm he founded in Manhattan. He has been an economist on Wall Street for over 25 years. He has visited central banking and large institutional clients in over 30 countries in his career as an economist. Mr. Brusca was a Divisional Research Chief at the Federal Reserve Bank of NY (Chief of the International Financial markets Division), a Fed Watcher at Irving Trust and Chief Economist at Nikko Securities International. He is widely quoted and appears in various media. Mr. Brusca holds an MA and Ph.D. in economics from Michigan State University and a BA in Economics from the University of Michigan. His research pursues his strong interests in non aligned policy economics as well as international economics. FAO Economics’ research targets investors to assist them in making better investment decisions in stocks, bonds and in a variety of international assets. The company does not manage money and has no conflicts in giving economic advice.
More Economy in Brief


