 Global| Aug 28 2007
German Business Types less Pessimistic about the Outlook than Financial Types
Summary
The results of the IFO August survey of the opinions of industrialists, wholesalers and retail traders show that while business is slightly more confident about the current situation, it is somewhat less confident about the six [...]
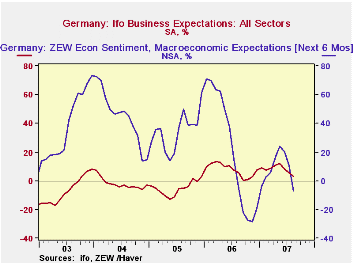
The results of the IFO August survey of the opinions of industrialists, wholesalers and retail traders show that while business is slightly more confident about the current situation, it is somewhat less confident about the six month's outlook. Optimist on the outlook exceeded pessimist by 3.3%, down from 5.9% in July. The opinions of the business community, however, are much less pessimistic than those of the financial community, as revealed in last week's ZEW survey, that showed an excess of pessimists of 6.9% in August, down from an excess of optimists of 10.4% in July regarding the six month's outlook. The first chart compares the opinions of the business and financial communities. In general, the opinions of the financial community are much more volatile than those of the business community.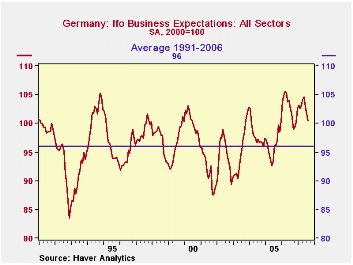
The IFO presents business expectations in terms of an index with a base year of 2000 as well as the percent balances of optimists over pessimists. The index for the entire period of its existence from January 1991 to the present is shown in the second chart, compared with the 1991-2006 average of the series. Although the expectations index has declined from 101.7 in July to 100.4 in August it is still significantly above the average.
| GERMAN BUSINESS CONFIDENCE (IFO) | Aug 07 | Jul 07 | Aug 06 | M/M Chg | Y/Y Chg | 2006 | 2005 | 2004 |
|---|---|---|---|---|---|---|---|---|
| Current Situation | ||||||||
| Index 2000=100 | 111.5 | 111.3 | 108.8 | 0.2 | 2.7 | 108.4 | 94.7 | 93.1 |
| Percent Balance | 18.6 | 18.3 | 13.3 | 0.3 | 5.3 | 12.5 | -14.2 | -17.2 |
| Expectations | ||||||||
| Index 2000=100 | 100.4 | 101.7 | 101.6 | -1.3 | -1.2 | 102.7 | 96.3 | 97.8 |
| Percent Balance | 3.3 | 5.9 | 5.5 | -2.6 | -2.2 | 7.9 | -5.1 | -2.0 |
by Robert Brusca August 28, 2007
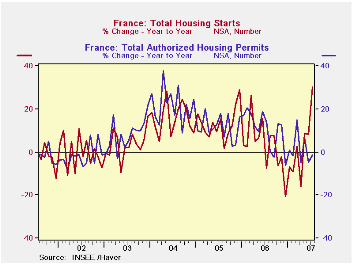
In France home construction is being stimulated by new tax rules. The new fiscal incentives allow home-buyers to deduct 40% of their mortgage interest payments from taxable income during the first year of contracts signed after May 6 and 20% during the four following years. This accounts for the jump in starts in May (up by 34.2% over April) and for April's nearly 30% drop from March as demand was depressed until after the new rule took effect. This incentive should allow developers to reduce stocks of unsold units built up in 1Q. The incentives will offset rising short- and long-term interest rates. Developers surveyed in July said buyers' financing had improved recently and expected this trend to continue in the near term, according to the national statistics institute Insee. The outlook for housing starts, based on permits on hand, has stabilized after a marked erosion since the start of the year. The new rule seems to play a large role in the timing of activity in French housing so far this year.
| Jul-07 | Jun-07 | May-07 | 3-Mo | 6-Mo | 12-Mo | |
| Starts | 2.7% | 4.6% | 34.3% | 333.2% | 66.4% | 30.1% |
| Permits | 1.9% | -3.8% | 11.6% | 43.0% | 6.0% | -1.3% |
| 3-Mo average | ||||||
| Starts | 11.8% | -0.3% | 8.3% | 112.7% | 45.5% | 15.0% |
| Permits | 2.9% | -6.2% | 1.9% | -6.4% | 11.5% | 0.1% |
by Tom Moeller August 28, 2007
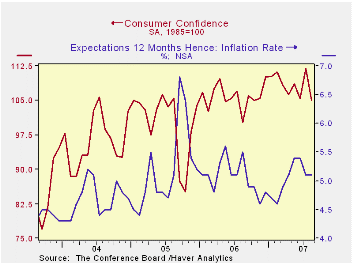
Consumer confidence in August fell according to the Conference Board Survey by 6.2%. The decline retraced all of the July increase of 6.3%. Confidence fell to the lowest level in a year.
The present conditions reading similarly fell a hard 5.8%, retracing all of the 6.5% July rise. The percentage of respondents who viewed business conditions as good fell and the percentage who viewed jobs as plentiful fell as well.
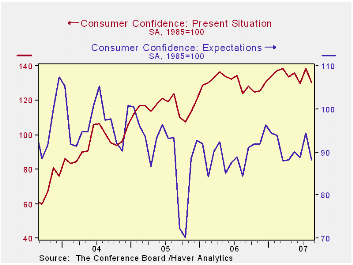
The expectations index also retraced all of the July rise with a 6.6% drop. Plans to buy major appliances fell to the lowest since late last year and plans to buy carpet also dropped.
The expected inflation rate in twelve months remained at 5.1%, equal to expectations during all of last year for inflation in twelve months.
| Conference Board (SA, 1985=100) |
August | July | Y/Y | 2006 | 2005 | 2004 |
|---|---|---|---|---|---|---|
| Consumer Confidence Index | 105.0 | 111.9 | 4.8% | 105.9 | 100.3 | 96.1 |
| Present Conditions | 130.3 | 138.3 | 5.2% | 130.2 | 116.1 | 94.9 |
| Expectations | 88.2 | 94.4 | 4.5% | 89.7 | 89.7 | 96.9 |
by Tom Moeller August 28, 2007
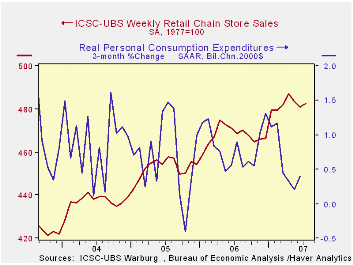
Chain store sales this month are 0.2% ahead of the July average of sales which rose 0.4% from June.
During the last ten years there has been a 45% correlation between the y/y change in chain store sales and the change in non-auto retail sales less gasoline.
The ICSC-UBS retail chain-store sales index is constructed using the same-store sales (stores open for one year) reported by 78 stores of seven retailers: Dayton Hudson, Federated, Kmart, May, J.C. Penney, Sears and Wal-Mart.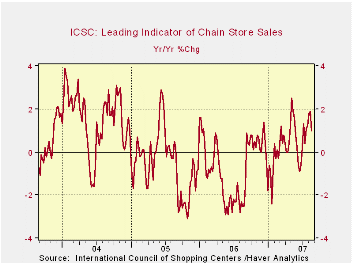
The leading indicator of chain store sales from ICSC-UBS fell 0.8% from prior week (1.0% y/y).
Gasoline prices for regular, on average fell four cents last week to $2.75 per gallon (-3.4% y/y).
The average gas price so far in August is 6.0% lower than in July and prices have fallen 14.6% from their peak during May of $3.22 per gallon.
The market price for regular gasoline in N.Y. harbor rose yesterday to $2.07 (17.3% y/y) 3 above the July average.
| ICSC-UBS (SA, 1977=100) | 09/04/07 | 08/18/06 | Y/Y | 2006 | 2005 | 2004 |
|---|---|---|---|---|---|---|
| Total Weekly Chain Store Sales | 483.4 | 482.0 | 2.5% | 3.3% | 3.6% | 4.7% |
More Economy in Brief
 Global| Feb 05 2026
Charts of the Week: Balanced Policy, Resilient Data and AI Narratives
by:Andrew Cates


