 Global| Aug 23 2005
German Investor's Confidence Rises Sharply in August: GDP Release Shows Increased Domestic Activity
Summary
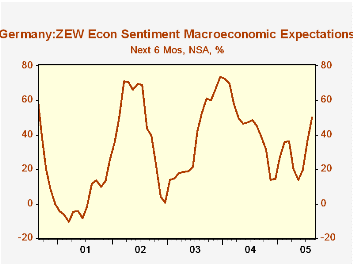
The ZEW Center for European Research announced that the institutional investors and analysts who respond to their survey on current and future conditions in Germany turned surprisingly optimistic in August as shown in the first chart. [...]

The ZEW Center for European Research announced that the institutional investors and analysts who respond to their survey on current and future conditions in Germany turned surprisingly optimistic in August as shown in the first chart. The balance of those expecting improved conditions in the next six months over those expecting worsened conditions rose to 50% from 37% in July. This was well above consensus and was the highest balance of optimists since March 2004. The recent decline in the euro has been one factor in the increase in confidence but there is also some suggestion that domestic activity within the economy is stirring. 
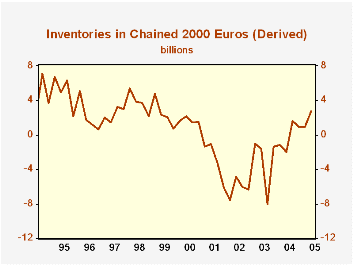
Such evidence is found in the details of the second quarter German gross domestic product released today. Investment in real terms both in plant and equipment and inventories rose and managed to overcome a decline in net exports and continued sluggish consumption. Total GDP increased a mere 0.01% in the quarter. The strongest rise was in inventories. Inventory liquidation has long been a drag on the German economy and the recent accumulation is encouraging, suggesting as it does that businesses are beginning to be more optimistic about future prospects.
In the German national accounts, inventories are shown only in current dollars. We derived a series in chained 2000 euros, by subtracting fixed investment from total investment, both in chained 2000 euros. This is not a proper procedure when dealing with chained dollars, however, it may suffice to give a rough estimate of the actual trend in real terms. The result is shown in the second chart.
| Germany | Aug 05 | Jul 05 | Aug 04 | M/M dif | Y/Y dif | 2004 | 2003 | 2002 |
|---|---|---|---|---|---|---|---|---|
| ZEW % balance | 50.0 | 37.0 | 45.3 | 13.0 | 4.7 | 44.6 | 38.4 | 45.3 |
| Billions Chained 2000 Euros | Q2 05 | Q1 05 | Q2 04 | M/M % | Y/Y % | 2004 Quarterly Avg |
2003 Quarterly Avg | 2002 Quarterly Avg |
| Total Gross Domestic Product | 531.56 | 531.51 | 528.41 | 0.01 | 0.60 | 527.87 | 522.15 | 523.14 |
| Final Consumption | 406.36 | 406.64 | 406.60 | -0.07 | -0.06 | 407.28 | 408.22 | 407.72 |
| Total Investment | 100.16 | 98.15 | 98.20 | 2.05 | 2.00 | 98.19 | 96.81 | 94.36 |
| Fixed Investment | 97.40 | 97.23 | 97.90 | 0.17 | -0.51 | 98.32 | 99.83 | 100.56 |
| Inventory (derived) | 2.76 | 0.92 | 0.30 | 1.84* | 2.46* | -0.13 | -3.02 | -6.20 |
| Exports | 222.30 | 219.63 | 214.38 | 1.22 | 3.69 | 212.41 | 196.13 | 191.71 |
| Imports | 197.21 | 192.80 | 188.21 | 2.29 | 4.62 | 190.08 | 179.15 | 170.71 |


