 Global| Dec 07 2009
German Manufacturing New OrdersDecline In October
Summary
German manufacturing new orders in volume terms fell 2.14% in October to 91.4 (2005=100) from 93.4 in September. This was the first drop since orders began to rise in March of this year. Domestic orders were down only 0.55% but [...]
 German
manufacturing new orders in volume terms fell 2.14% in October to 91.4
(2005=100) from 93.4 in September. This was the first drop
since orders began to rise in March of this year. Domestic
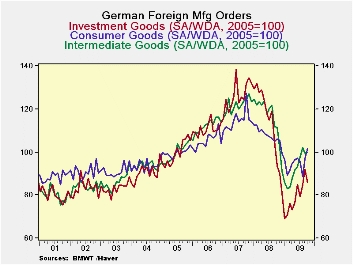
orders were down only 0.55% but foreign orders declined 3.48%. The
continued rise in the Euro is taking its toll on German
exports. A decline of 6.74% in foreign demand for investment
goods accounted for the drop in foreign orders. Foreign orders for
consumer goods actually increased by 5.27% in October and foreign
orders for intermediate goods rose slightly--0.30% . Foreign
orders are shown in the first chart.
German
manufacturing new orders in volume terms fell 2.14% in October to 91.4
(2005=100) from 93.4 in September. This was the first drop
since orders began to rise in March of this year. Domestic
orders were down only 0.55% but foreign orders declined 3.48%. The
continued rise in the Euro is taking its toll on German
exports. A decline of 6.74% in foreign demand for investment
goods accounted for the drop in foreign orders. Foreign orders for
consumer goods actually increased by 5.27% in October and foreign
orders for intermediate goods rose slightly--0.30% . Foreign
orders are shown in the first chart.
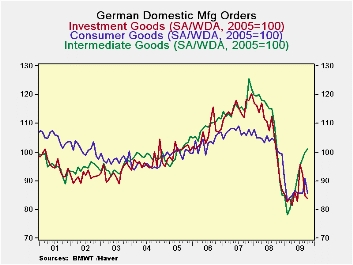 Domestic
demand for investment
goods also declined in October, but only by 1.18%. In
contrast to the rising foreign trend, orders for domestic consumer
goods fell by 5.84%, reflecting lack luster retail sales.
Domestic demand for intermediate goods increased by 1.20%.
Domestic orders are shown in the second chart.
Domestic
demand for investment
goods also declined in October, but only by 1.18%. In
contrast to the rising foreign trend, orders for domestic consumer
goods fell by 5.84%, reflecting lack luster retail sales.
Domestic demand for intermediate goods increased by 1.20%.
Domestic orders are shown in the second chart.
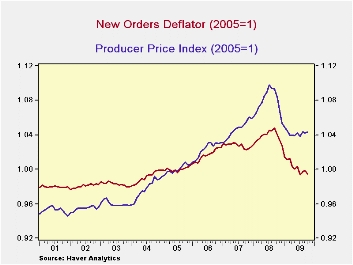 An
indicator of the
price level of new orders can be computed by dividing the value series
by the volume series. The resulting calculation is shown in
the third chart compared with the Producer Price Index for
manufacturing. The two indexes show the same broad
trends. The PPI has been falling since June 2008 and appears
to be leveling off. The new orders index has been declining
since September 2008 and is yet to level off.
An
indicator of the
price level of new orders can be computed by dividing the value series
by the volume series. The resulting calculation is shown in
the third chart compared with the Producer Price Index for
manufacturing. The two indexes show the same broad
trends. The PPI has been falling since June 2008 and appears
to be leveling off. The new orders index has been declining
since September 2008 and is yet to level off.
| Oct 09 | Sep 09 | Oct 08 | M/M % CHG | Y/Y % CHG | 2008 | 2007 | 2006 | |
|---|---|---|---|---|---|---|---|---|
| Manufacturing New Orders | 91.4 | 93.4 | 99.9 | -2.14 | -8.51 | 111.3 | 119.7 | 108.7 |
| Domestic | 91.2 | 91.7 | 99.5 | -0.55 | -8.34 | 108.3 | 114.8 | 106.8 |
| Foreign | 91.5 | 94.8 | 100.2 | -3.48 | -8.77 | 113.8 | 124.0 | 110.8 |
| Foreign New Orders | ||||||||
| Intermediate Goods | 99.8 | 99.5 | 111.6 | 0.30 | -10.57 | 115.9 | 121.7 | 112.2 |
| Investment Goods | 85.8 | 92.0 | 93.7 | -6.74 | -8.43 | 113.5 | 126.2 | 110.7 |
| Consumer Goods | 101.9 | 96.8 | 105.9 | 5.27 | -3.78 | 107.5 | 114.8 | 105.3 |
| Domestic New Orders | ||||||||
| Intermediate Goods | 101.2 | 100.0 | 100.9 | 1.20 | 0.50 | 110.6 | 116.1 | 108.5 |
| Investment Goods | 83.8 | 84.8 | 98.4 | -1.18 | -14.84 | 107.2 | 115.2 | 106.1 |
| Consumer Goods | 85.5 | 90.8 | 100.5 | -5.84 | 14.93 | 103.6 | 107.0 | 103.2 |
| Prices (Value Index/Volume Index,2005=1) | .995 | .999 | 1.011 | -0.44 | -4.47 | 1.038 | 1.028 | 1.017 |
by Tom Moeller December 07, 2009
 The
November employment report indicated that the number of temporary help
jobs grew by 52,400, the fourth consecutive month of increase. Since
July temp employment grew by 116,900 (6.7%), a gain which outstripped
the 95,500 (0.7%) four-month increase in health care employment, the
48,800 (1.9%) rise in social assistance payrolls, the 40,000 (0.8%)
gain in state gov't jobs as well as the few others.
The
November employment report indicated that the number of temporary help
jobs grew by 52,400, the fourth consecutive month of increase. Since
July temp employment grew by 116,900 (6.7%), a gain which outstripped
the 95,500 (0.7%) four-month increase in health care employment, the
48,800 (1.9%) rise in social assistance payrolls, the 40,000 (0.8%)
gain in state gov't jobs as well as the few others.
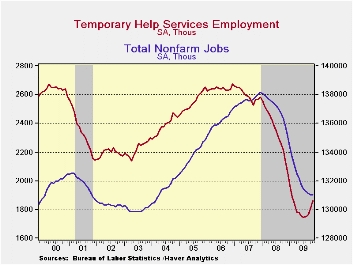
Not only has the growth in temp jobs been impressive, but as a leading indicator of full-time employment it bodes well for the job market. During the last two economic cycles temporary employment began growing a year or two before the recoveries in total employment, which both lagged the official end of the recessions.
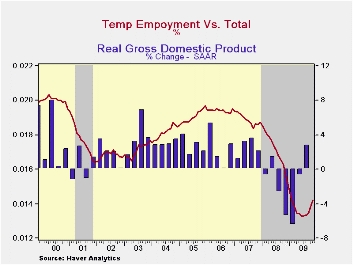 The ratio
of temp employment-to-total
payroll jobs also has value as a cyclical indicator. During the last
ten years there has been an 85% correlation between the ratio and real
GDP growth. Five years ago, a higher ratio near 2.0% was consistent
with 3.0% growth in real GDP. Temporary help jobs increased due to
workers' hours-worked flexibility and, for the most part, lower benefit
costs. Then, as economic growth eased, the ratio fell to its current
1.4%, the lowest level since 1994.
The ratio
of temp employment-to-total
payroll jobs also has value as a cyclical indicator. During the last
ten years there has been an 85% correlation between the ratio and real
GDP growth. Five years ago, a higher ratio near 2.0% was consistent
with 3.0% growth in real GDP. Temporary help jobs increased due to
workers' hours-worked flexibility and, for the most part, lower benefit
costs. Then, as economic growth eased, the ratio fell to its current
1.4%, the lowest level since 1994.
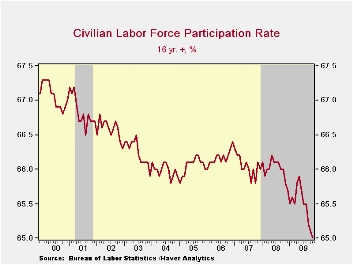 Overall,
economic
recovery will bolster not only full-time employment, as usual, but temp
jobs as well. If the Consensus 3.0% growth forecast through the end of
next year is on the mark, temp employment should rise along with its
share of the total; indicating a greater number of workers re-entering
the workforce. That would turn-around the decline in the labor force
participation rate which recently has plumbed a 25-year low of 65.0%.
However, the "quality" of those new jobs likely will differ greatly
from the benefits of full-time employment.
Overall,
economic
recovery will bolster not only full-time employment, as usual, but temp
jobs as well. If the Consensus 3.0% growth forecast through the end of
next year is on the mark, temp employment should rise along with its
share of the total; indicating a greater number of workers re-entering
the workforce. That would turn-around the decline in the labor force
participation rate which recently has plumbed a 25-year low of 65.0%.
However, the "quality" of those new jobs likely will differ greatly
from the benefits of full-time employment.
Why do firms use temporary workers? from the Federal Reserve Bank of Chicago can be found here.
Today's speech titled by Frequently Asked Questions Fed Chairman Ben S. Bernanke is available here.
| Nonfarm Payrolls | November | October | September | Nov. '08 | 2008 | 2007 | 2006 |
|---|---|---|---|---|---|---|---|
| Temporary Help (000s) | 1,862.1 | 1,809.7 | 1,765.6 | 2,128 | 2,346.4 | 2,599.4 | 2,641.6 |
| Share of Total Jobs (%) | 1.42 | 1.38 | 1.35 | 1.57 | 1.71 | 1.89 | 1.94 |
More Economy in Brief

 Global| Feb 05 2026
Charts of the Week: Balanced Policy, Resilient Data and AI Narratives
by:Andrew Cates

